Hi Traders,
This analysis is on the STEEM/BTC pair on the 120 timeframe (poloniex).
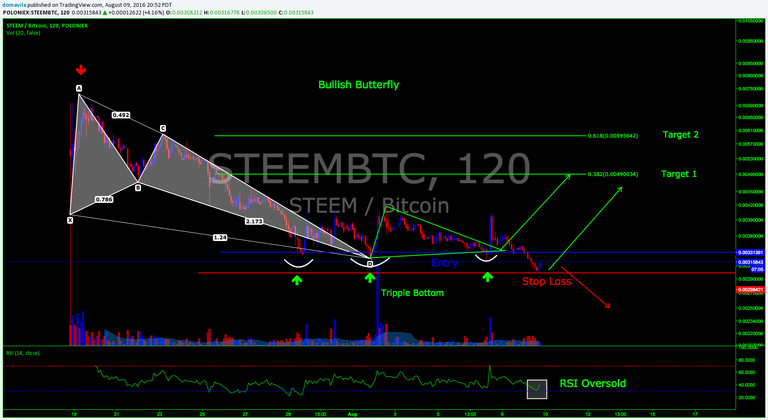
Well, it looks like price retested the lows for the fourth time in the PRZ (Potential Reversal Zone) and once again support held, but not after price reached a new 24 hour low at 0.00302001 BTC. 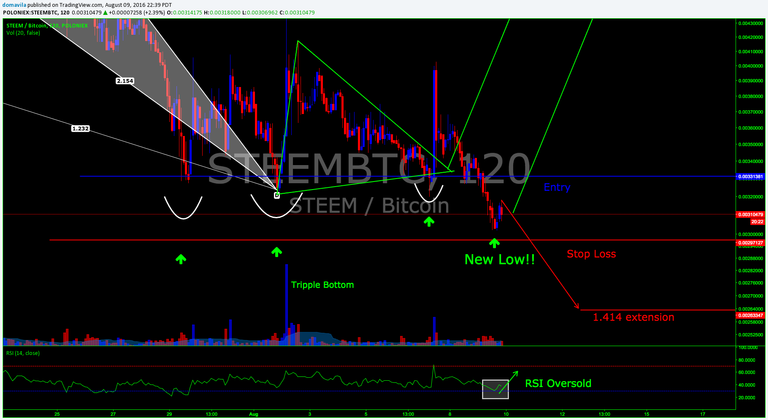
When price consolidates like this after the completion of the Bullish Butterfly
it becomes tricky to trade and is one of the more difficult scenarios one encounters in harmonic trading. This example is harder to trade because in harmonic trading we are used to seeing impulsive moves... and this is not the case.
What does this mean?
This means that we should be more patient and wait for a good signal to go long.

...and we might have one right here.
It looks like the steem bulls defended the 0.003 BTC handle very nicely and we had a nice upside reaction. This could be a sign that the bears have run out of "steem". -pun intended.
In addition, RSI is in oversold territory and is beginning to head north which is an indicator that we might have a reversal. Another thing to note is RSI often likes to retest the oversold area once or twice before making a move so it is possible to see price retest the previous low of the day.
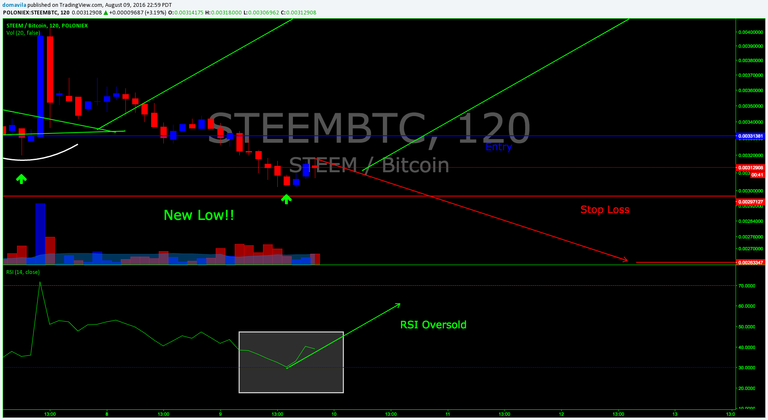
If price fails to breakout to the upside and if support fails to hold for this last time we could expect to see new lows and test the 1.414 fibonacci extension around 0.00264 BTC seen below.
If this occurs I will be stopped out of my trade around 0.003 BTC and will be looking for a possible long entry in the 0.0026 BTC-0.0025 BTC range depending on price action.

If you have been following my previous analysis here and have watched my live trade in action you will know I have been bullish on STEEM. You can watch this trade play out live and see my up to date comments right here on TradingView
Please feel free to question, comment and post your charts and technical-analysis in the comments section below.
Disclaimer
This is not financial advice and is for educational purposes only.
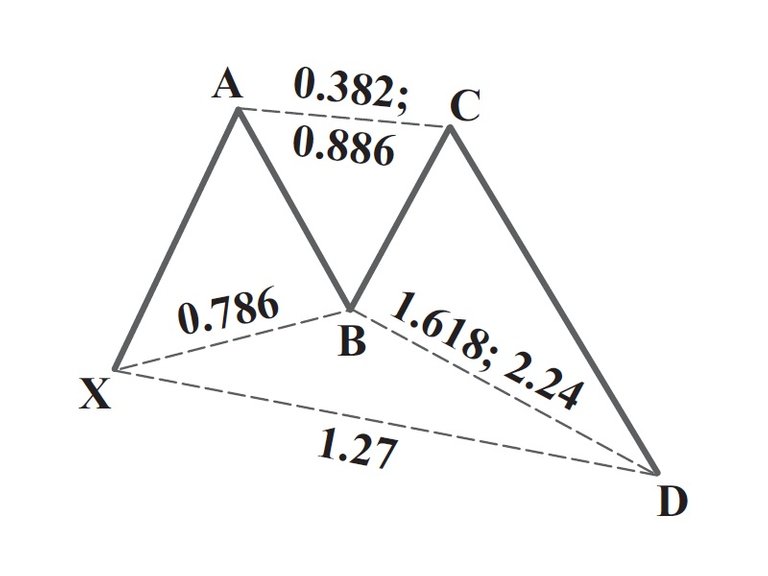
Harmonic Trading was invented by Scott Carney
Please follow me on Twitter for all things crypto and on TradingView.
Happy trading!!
Update
Image Here
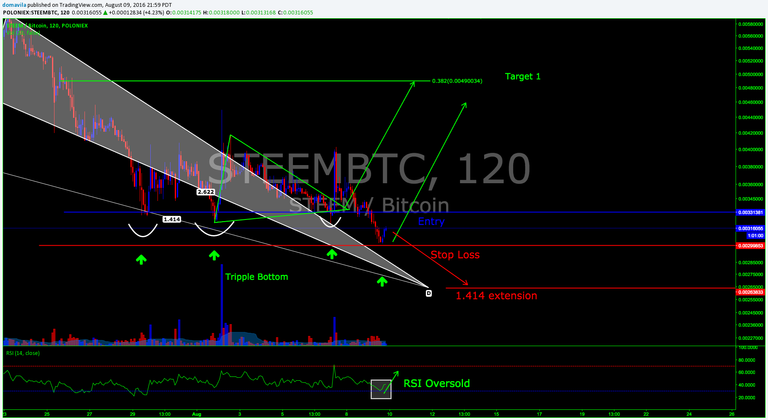
I am currently looking at these two possible scenarios. A new harmonic pattern might have emerged! This gives me another possible bullish area (PRZ) to watch out for, now in the 0.029-0.0285 range. This area might be the last chance for the steem bulls before bear country takes over.
nice post
Thanks a lot @i603. I will post a new blog about my current trade on the deep crab late this evening or early tomorrow morning. I will link it here so you can follow my further analysis in the STEEM/BTC pair.
Very nice charting and explaining please keep it up!
Sorry for not checking it out earlier, I am currently traveling so I check steemit whenever I get back to wifi! but im actively following :)
Right on @ozchartart!! Thank you for following and commenting, it is greatly appreciated!!
Keep up the good work Dom! Get ready for @thepanel !!!
Yea @smiggs!! I cant wait for @thepanel!!
Constantly loosing value....The money to pay all the posts must come from somewhere. We need big money to enter the dance, otherwise we will only see a slow death.....
@artakan This is a key area where the bulls and bears are fighting it out. Steemit is still very young and in Beta...of course there will be growing pains like everything in life but there are many people hard at work creating applications, ideas and businesses built around steem.
UPDATE 2
This trade has been stopped out at 0.003 BTC!! It is always unfortunate when loosing a trade but losses are part of the game. The important thing is to keep your losses small and minimize risk.
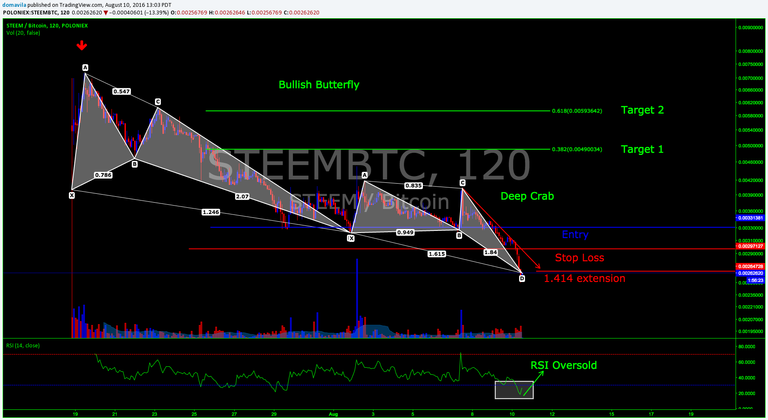
In the first update I mentioned a new harmonic pattern was forming and it appears as if a Deep Crab has emerged.
If you look at my chart you can see the bears pushed price down into the predicted range at the 1.414 fibonacci extension of the AD leg (of the Deep Crab). This combined with the completion of Deep Crab are signals go long.
In addition, RSI is extremely overbought and sellers look like they could be exhausted here.
I will place a link to my upcoming analysis and future live trade here in this post.
#domavila
#harmonictrader
Sorry. Just looks like a lack of buyers
@cryptorambler or it could be seen as a influx of sellers. With all the whales powering down and all the posts from individuals who are new to crypto cashing their winnings their is a lot of downside pressure.
It doesn't really matter if it is a lack of buyers like you said or a increase of selling like I said. The result remains the same, which is more supply than demand. I don't trade fundamentals but that's how I see it. Let's see if support holds at current levels and if this deep crab plays out.
Thanks for commenting @cryptorambler.
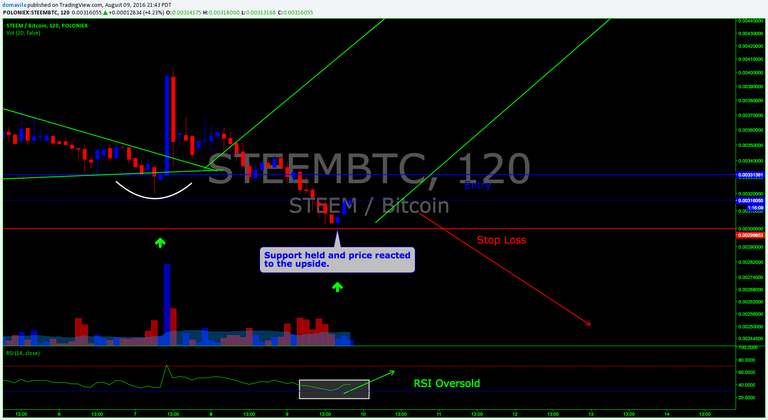
UPDATE 3
Here is my new analysis for this pair. Thanks for following everyone.
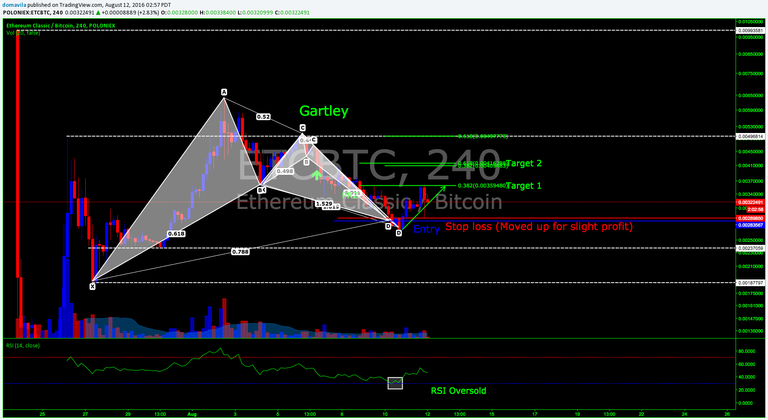
I have abandoned the crab and have spotted a near perfect Gartley. My further, continued analysis, will be focused on this now.
Thanks,
@domavila
#harmonictrader