Steem has been trending sideways for the past few days and has been consolidating within the range specified by the rectangle on the chart below.

This analysis is done on the STEEM/BTC pair 120 min, on the Poloniex exchange.
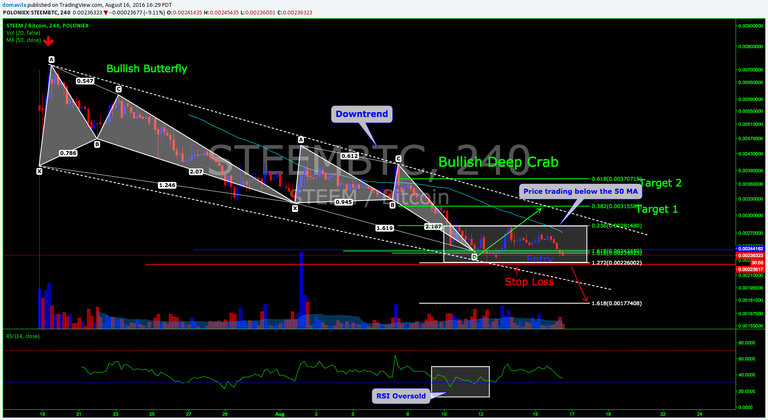
If you have been following my previous analysis on this pair, you will know I took a long position on steem after the completion of the bullish deep crab. This, combined with price finding support at the 1.618 fibonacci extensions and 1.272 fibonacci projection, provided further evidence for my case to go long.
Case for the bulls
Although the price of Steem has dropped significantly in the past few hours and is retesting previous lows in the PRZ or potential reversal zone, price appears to be holding near fibonacci support at the 1.618 extensions and could be setting up a nice Type 2 harmonic trade (Please fast forward to 7:50 on the video to learn about a Type 2 setup). Price is currently retesting the lows at the previous completion of the deep crab and if support holds here this could be a nice reversal point for the Steem bulls.
Case for the bears
Steem still continues to trend in the month long decending channel which is quite bearish. Every time the bulls try and push price higher the bears quickly shut them down. The price of Steem is currently trading under the 200 MA and 50 MA on the 240 min chart, and has recently dipped under the 50 MA on the 120 min timeframe which are bearish indicators.
View Image
RSI
RSI showed a trend line break of support earlier today, which coincided with the dip in price. I could see RSI dipping lower with price and will be looking for bullish confirmation once RSI finds a bottom and starts turning upwards again.
View Image

Conclusion
As the bears and bulls continue to fight it out in this range I will be looking for the bulls to break the 0.236 fib near the 0.0028 mark for confirmation of a bullish reversal.
If the bears push price lower than 0.00225 BTC I will be looking for the next bearish target, near the 0.00177 BTC range at the 1.618 fibonacci extension. This might be a good area to buy cheap steem if the bears can push price here.
Please feel free to question, comment and post charts in the comment section below. Also, watch my live trade play out here in real time.
Isn't it better to forecast in terms of steem/usd to have a more stable currency to compare it to? Because if you were more bullish on bitcoin than steem (despite being bullish on both) you may want to limit exposure
stop hunts aren't as brutal.Hey @daut44 , what's up brotha? The STEEMBTC market has more volume and liquidity than the STEEMUSD pair so that is why I trade and chart the STEEMBTC vs. STEEMUSD pair. I do the same with ETH and ETC too. Liquidity is a huge issue in these thin markets so I prefer to trade in the markets with the most liquidity, that way I minimize slippage when getting in and out of trades and the
very nice! please keep it up! i'm also learning every day!
I noticed we posted in the same exact sec! XD
Right on at @ozmaster!! The more I post the more I learn as well. We posted almost at the exact same time!! We must be in the charting Matrix!!
Great analysis. STEEM continues to emerge and we are all along for the ride
@thebeachedwhale These are exciting times indeed. After a period of consolidation we often see price move rapidly in a direction. The question remains... which direction? Looks like we will have to be patient and wait and see.
To be honest. Bullish Deep Crab sounds delicious! hehe :)
The plus side of if steem pushes through lows to the lowest Fib level is that we will have pulled extremely far from the MAs, which means a bounce would be in order.
Steemed" Bullish crab!! Haha@scaredycatguide. A "
Hahaha....that was funny!
nice forecast
i ever learn harmonic trading strategy but i does not really understand how to use its on trading glad you use harmonic trading on your trading plan so i can continue to learn it.
Thanks for commenting @nessacute. I always post links in my articles so those who wish to learn more about harmonic trading have access to the materials I mention. Please feel free to ask any questions and I will try my best to answer.
UPDATE
Target 1 has been hit after the bullish deep crab completed! The above example, clearly shows the power of harmonics and how it is a excellent trading methodology.

View Image
As the trading plan states, I have closed half my position at Target 1 and raised my stop loss to slightly above break even. Next, I will let the other half of my position ride with the 0.618 retracement (Target 2) as our next goal.
Stay tuned for my continued analysis on the STEEM/BTC pair in my next article as I delve deeper into this bullish deep crab and how to trade it.
You can watch my live trade play out right here! Remember to hit the play button on the chart to see it play out.
Lets see if we can hit target 2 next, and thanks for liking and commenting everyone!