As sellers take over the STEEM/BTC pair and push price to new lows some of us might be asking the question..how low will it go?
Lets take a look at some analysis and see if we can find the next support level for Steem.
This analysis is on the STEEM/BTC pair on the 240 minute timeframe. Data provided by Poloniex and charted in TradingView.
Previous Analysis and Reflection
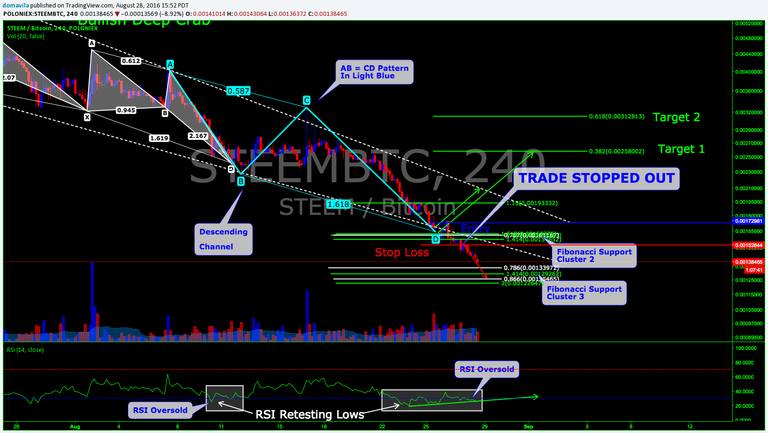
If you were following my previous analysis you would know I took out a small long position at the completion of the AB=CD harmonic pattern at the 1.618 extension. Also, this level was a possible support level, shown by the Fibonacci Support Cluster 2 on my chart.
View Image
If you were following my live trade, you would know that I was stopped out of this trade. Being a trader, one has to be fine with loosing because it happens quite frequently. In fact, I barely win over 50% of my trades. The way I am actually successful at trading is because I stick to my plan and the [risk to reward ratio] on my trades is 2 at a minimum.
If you look at my previous trade you could see that the risk to reward ratio is 4.25. Even though the trade was a looser the risk to reward ratio was quite good so in retrospect I am ok with taking the trade. In addition, the long position I entered was very conservative. I had further downside targets in mind where the third Fibonacci Support Cluster sits so I did not risk much on this trade. -Please note that the Fibonacci Support Cluster 1 was erased from my chart because it was no longer relevant. The 2nd support cluster is invalid so I will erase the Fibonacci Support Cluster 2 from from my chart for my continued analysis.
Where are we now?
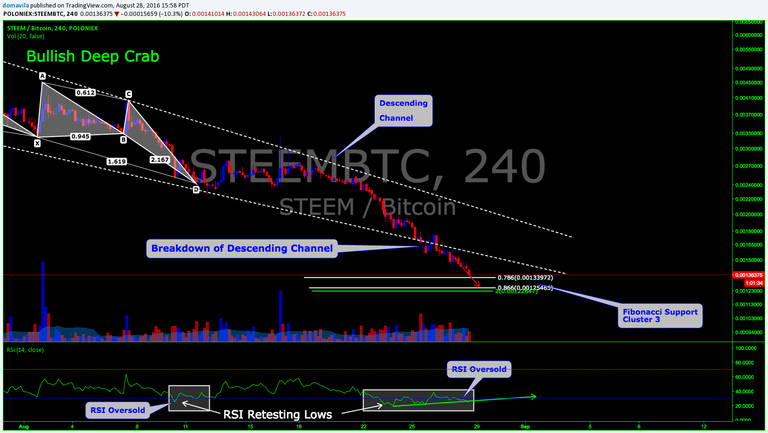
Continued selling pressure is pushing the Steem price to new lows for the 7th consecutive day. The bears have been relentless in this battle and are clearly winning the war.
Sellers have finally broken out of the [descending channel] and price action still looks very bearish. The daily chart looks gruesome for the bulls.
Our next "possible" support level that I am looking at is the Fibonacci Support Cluster 3. After drawing several fibonacci: extensions, retracements and projections from key "high and "low" levels and many of them converged in this area. I will be watching price action carefully in this area and will be looking for another possible entry.
Please note, as the trend continues to go down, entering a long position is counter to the trend. Countertrend trading requires a certain type of personality and trade plan. My method of trading is based on harmonic patterns that predict reversals in the market. This type of trading style requires practice, backtesting, and of course plenty of study before putting it into real practice.
Here is a small definition of Harmonic Trading as explained by the creator of Harmonic Trading, Scott Carney.
What is Harmonic Trading?
Harmonic Trading is a methodology that utilizes the recognition of specific price patterns and the alignment of exact Fibonacci ratios to determine highly probable reversal points in the financial markets.
This methodology assumes that trading patterns or cycles, like many patterns and cycles in life, repeat themselves. The key is to identify these patterns, and to enter or to exit a position based upon a high degree of probability that the same historic price action will occur. Although these patterns are not 100% accurate, these situations have been historically proven. If these set-ups are identified correctly, it is possible to identify significant opportunities with a very limited risk.
Case for the Bulls
It looks like the bulls are loosing this war as the bears push the price of Steem continuously lower. There might be some hope on the horizon at the Fibonacci Support Cluster 3 but that is further down the road. For now I would say the bulls only have two things going for them.
RSI
RSI is still oversold and should start turning to the upside soonVolume
Volume has been decreasing of late, and the bears appear to be getting exhausted. They might tire out soon and could see some upward pressure soon.
Case for the Bears
- Downtrend
It is clear we have been is a downtrend for quite some time. Until we see a clear reversal this looks very bearish - Lower lows
The bears have managed to push the price down day after day. this is very bearish. - The descending channel
The bears have already broke the descending channel to the downside and looks like a breakout. - The 50 and 200 MA's
Price continues to trade under the 50 and 200 MA's which is bearish.
Conclusion
For the meantime I will sit on the sidelines and will wait to see if support holds at the Fibonacci Support cluster on my chart. If you look at my chart you can see price follow my red down arrow. Lets see where price goes from here. To me it looks like we are in store for more down.
It is possible that you missed it, but the price is falling because dev team is pushing it downward, to distribute SP. They are actually losing money doing so:
https://steemit.com/steemit/@magnebit/steem-price-is-being-pushed-down-by-1-person-speculation-on-why-and-where-it-may-end-up
Especially the comments.
Thanks for commenting. I trade price only and I am not a fundamental trader. That being said, yes I read that article.
I have been in the crypto space for quite some time and so am very weary of any platform or new crypto currency. The only crypto currency I truly have faith in is Bitcoin (no offense to steemit). I have no response about that article because I dont have enough info to comment but thinking they are pushing price down to sdistribute to others as
Some alturistic deed seems a little far fetched to me. But who knows.
Well, it was outlined in the previous posts by @dantheman and all. They are also getting fiat/btc to pay for developmet and stuff like that. Thing is to see the price fluctuations it is probably a good idea to monitor the power down by @steemit, and the trades. The rally would likely happen soon after it stops powering down.
True. Monitoring the @steemit power down could be wise, it makes sense that they are powering down for development too. Thanks for pointing that out @xanoxt.
i just upvoted your post , please upvote mine im trying to attract the gaming community to steemit , and you might win the game key
https://steemit.com/steemit/@nabilov/giveaway-1-digital-game-the-game-is-a-surprise-main-story-the-real-story-behind-5-nights-at-freddys
Done., I am always down to introduce more individuals to the steemit space. The gaming community is huge.
Sidelines are looking good - but there may be a glimmer of light. There is divergence on MACD (and RSI). I am more keen using divergence on MACD as a reversal signal. Waiting for the reversal on the daily would be my plan.
Note: MACD is still very bearish - well below zero.
That's some serious divergence right there.
Thanks for posting that chart. I was going to mention divergence but I was in a hurry to leave my house. Thanks for pointing that out.
UPDATE
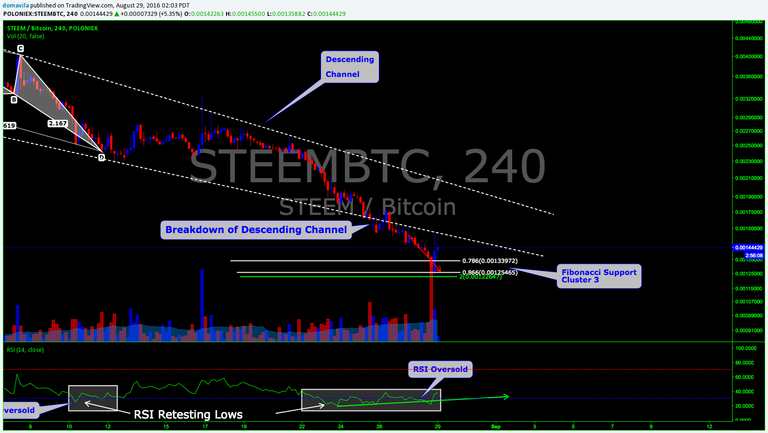
After price dropped and stopped at the last Fib cluster we had a nice bounce at support. This was the main level I was looking at. Notice how price followed the red down arrow and then bounced at support?
Lets see if it can last.
View Image
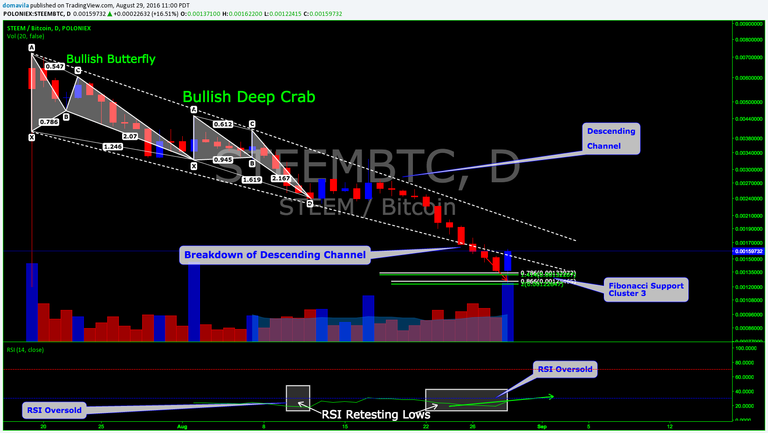
I will be looking at the daily for a clear reversal - then look to 4 hourly for trade entry
Good call on that fibs cluster!
We might get a daily bullish engulfing candle, which I assume would at least lead to some sideways (ranging) price action for the next few days. It could also mean that a bottom is in (although it likely needs testing after such a long movement downward - double bottom)
Right on @jamesbrown, thanks. So far so good, we could see a retest of the lows like you mentioned and if it holds we could see a reversal in the area. Thanks for pointing out the bullish engulfing candle on the daily, looks good.
View Image