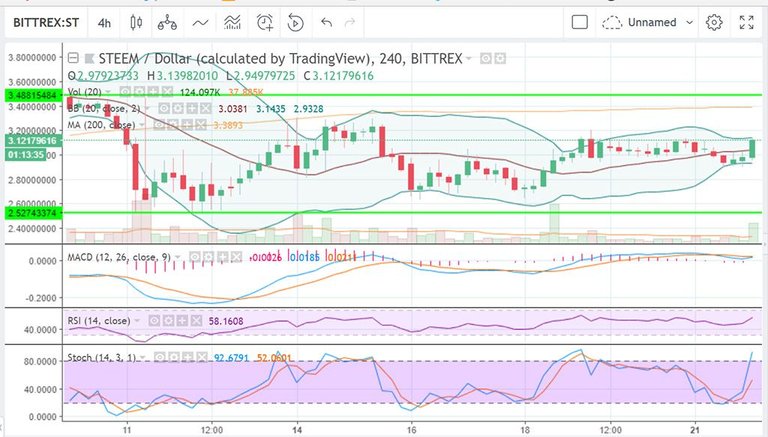
The 4 hour chart tells the story on Steem as the volume picked up as the Asian Markets opened as Steem broke through the 20 day moving average. The move has been very sharp and Steem it at the top of the Bollinger Bands. The MACD has crossed to the upside.
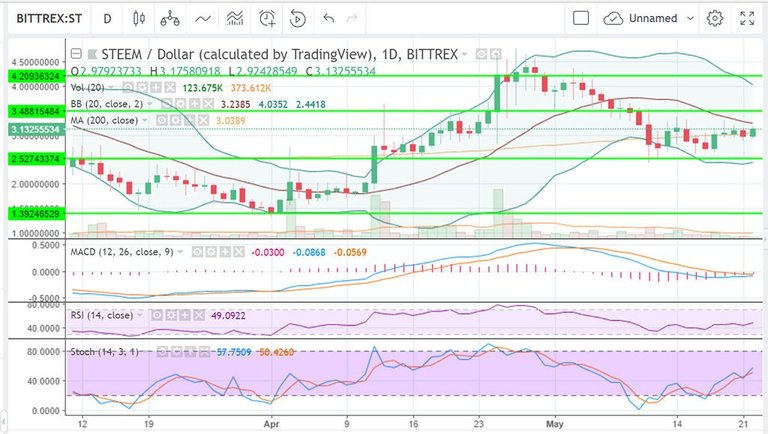
All the indicators on the one day chart are looking positive. The MACD may cross soon which will be very bullish. Steem is facing resistance on the 20 day moving average at around $3.25.
4 hour
1 day
If you don't have a Binance account, and like our posts, and are going to set one up (especially to trade STEEM) we would appreciate if you support our efforts by using our referral link. It doesn't cost you anything and it helps fund our efforts. Mahalo.
Click here to set up your Binance account
(We are not professional traders this is just our opinion. The above references an opinion and is for information purposes only. It is not intended to be investment advice. Seek a duly licensed professional for investment advice.)
where do you think Steem will be by the end of the year?
Thanks
Thanks for the comment. The problem is the weekly chart which looks to be a Descending Triangle. If you plot it out and it stays in the pattern it could return to the $1.50 level UNLESS we see a bullish move in Bitcoin.