Don't forget the AB=CD harmonic pattern that completes near one of those big Fibs clusters, not to mention horizontal price support around that same level (you can't see it on Poloniex or Trading View's charts, but you can on Bittrex, which has a longer price history). That makes for a confluence of a harmonic pattern completion, at least three fibs extensions (circled in red on my chart) and the horizontal price support - at least 5 supports converging together; that I call a kill zone.
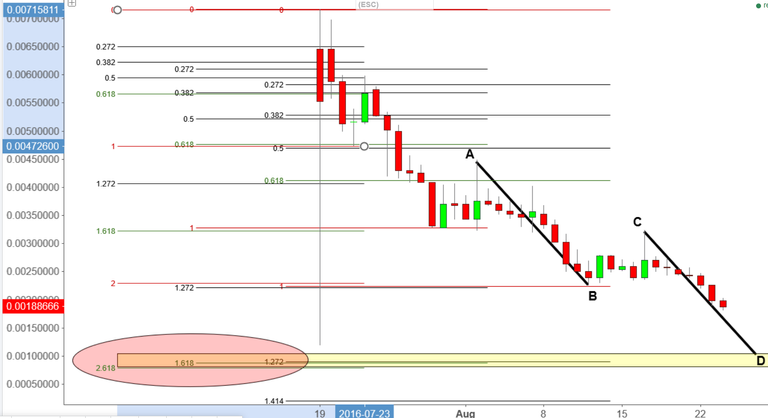
Not to get too overconfident, though. Price can certainly break all this support in a single day. You're right to point to the price channel as a good indicator of possible change of bias (bear to bull).