
Follow me @steemcharts for daily updates on Steem prices, Bitcoin Prices, Steem statistics and Technical analysis.
Please leave a comment and an upvote as well! Also, let me know if you have any wishes for charts that I should do.
Disclaimer: This is not investing advice. These charts are for fun and beginners. An easy to understand basic introduction to charts.
BTC
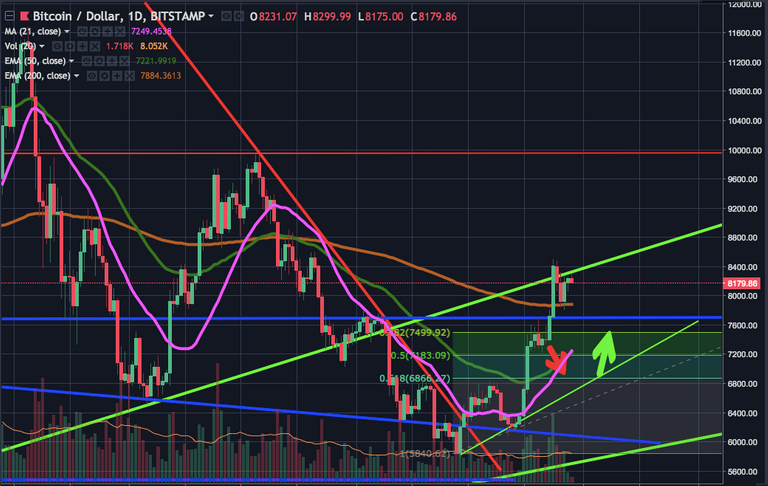
Two days ago I said that the ETF news was not fake, but wrong (as in they left out some important info). The Winklevoss ETF was first of all not the application we have been waiting for, it was merely another try at getting the ETF approval from this spring through another time. Also, the SEC chairwoman who voted FOR the ETF was also very vocal about it on Twitter and gained massive attention from the space.
BTC did not fall big, as expected. But we are in limboland on low volumes. I suspect big moves soon, and I suspect big moves up. This is a whale market. And ironically the argument from SEC was that the market is too volatile and fragile..which ironically an ETF would help solve. But ETFs ARE coming. They are all ready in place in Scandinavia and UK.
ETH
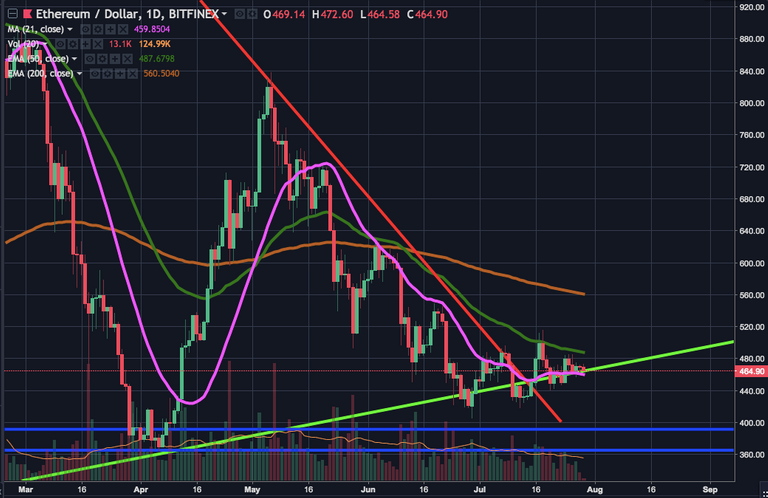
Other than ETH being a trading par for the Tether scam that went on yesterday on an obscure exhange (exx) and then dumped on another weird exchange, nothing exciting goingon.
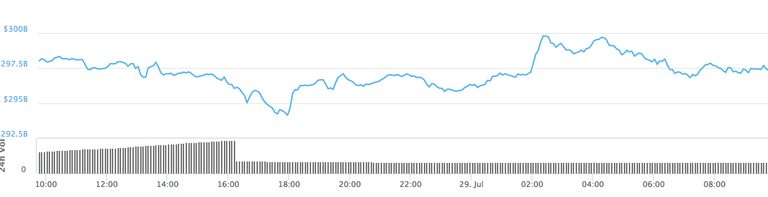
Look at this funny volume drop for total mcap. That was because of USDT/ETH
&nbps;
STEEM
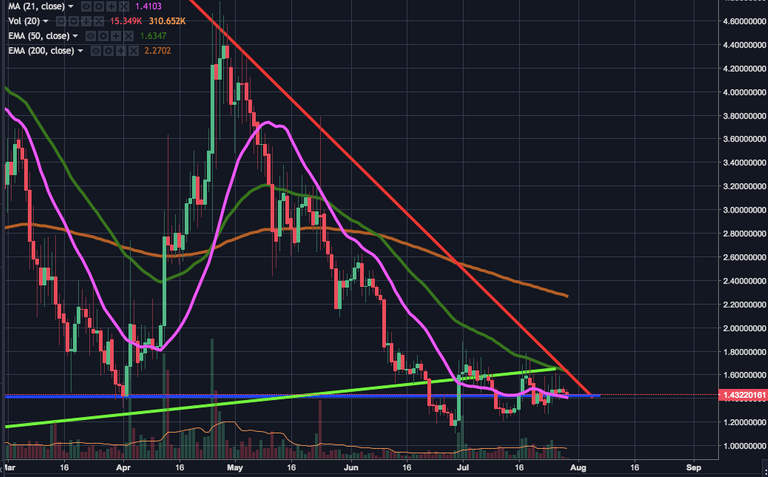
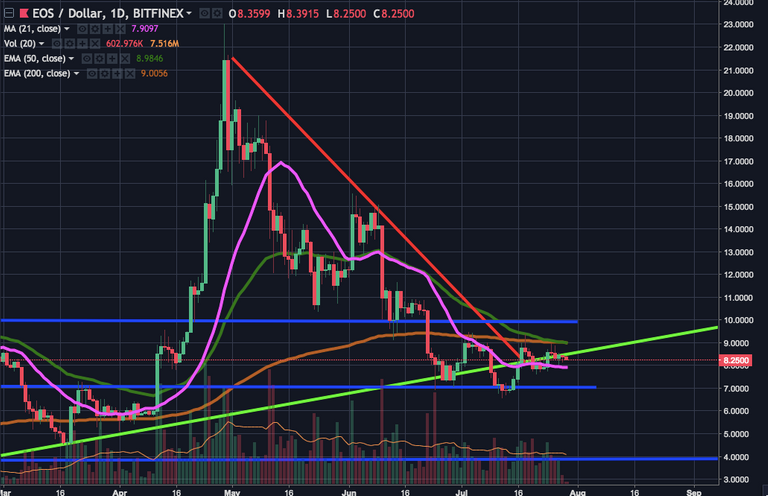
EOS
NEO
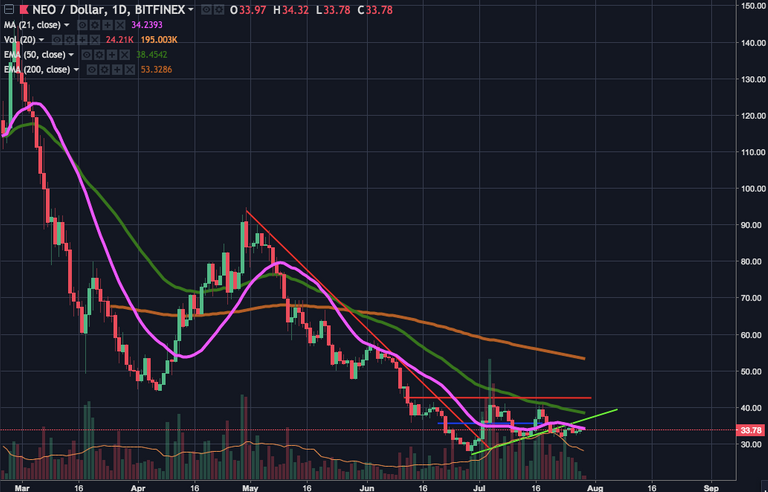
NEO doing slightly better than EOS and STEEM
Follow me @steemcharts for daily updates on Steem prices, Bitcoin Prices, Steem statistics and Technical analysis.
Please leave a comment and an upvote as well! Also, let me know if you have any wishes for charts that I should do.
Disclaimer: This is not investing advice. These charts are for fun and beginners. An easy to understand basic introduction to charts.

As expected the weekend saw very slow movements within the crypto currency market, with prices ranging between $8,060 - $8,310. Price consolidated mainly around this area for the majority of last week, unable to breakout of this range and continue its movement. This could be a very good thing, as consolidation within a strong area can often mean price is slowly gain strength and will eventually breakout, which way is breaks out is still hard to speculate.
When we go down to the 4hr chart we can see the clear consolidation and range that price is ranging within. Late last week price broke to the downside but it was only momentarily, with price being rejected at the $7,800 region and quickly shooting back within the $8,060 - $8,310 range. I wont be actively trading BTC until it clearly breaks this range. If price can break to the upside and close above the major psychological level of $8,600 which i believe it will, we could see price take off towards the $10,000 region.
Thank you for your thoughts @stevewakeham332!
Give us some bullish volume and MAC D crosses.
!!