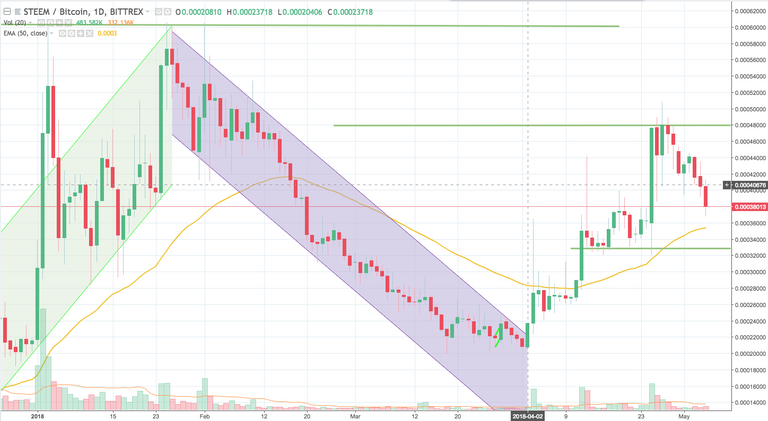
Here's a weekend note on STEEM/BTC. Have a look at the latest snapshot of the daily chart on STEEM/BTC:

As you can see, we've gone lower the past 3 days. I had to re-assess what the chart is showing, and here are some points to note:
If price continues to move lower, the first area of support will be the 50-EMA line which is currently hovering at 0.00035400.
Below that, I've drawn a support line, based on price action for the past 3-4 weeks (see the green line in between 0.00032 and 0.00034). As you can see, price has bounced off this 0.00033 level a number of times over the past few weeks. Hence, I believe this should hold as a strong support base if price does indeed fall to this level.
Lastly, I've put the immediate resistance around 0.00048.
These 3 points seem to be what the charts are revealing lately. All things said though, from a big picture perspective, we can still consider price to be in an uptrend and that the recent moves can be regarded as retracements. I will revisit this again next week. Until then, wishing you all a happy weekend ahead.
Risk Warning: All comments, charts and analysis on this post are purely my own and should in no way be treated as recommendations or advice, nor should they be construed as an endorsement or recommendation to buy, sell or hold. Please do not trade based solely on the information provided on this post. Furthermore, past performance does not guarantee future success. Always do your own due diligence and analysis when trading.
Chart courtesy of TradingView
seen from trend pattern tends to decrease. the outline of the pattern rises, only this in an unfavorable situation..
Hi @ahyargeos, I'm not sure I got your point. If you can expound a bit further, that will be great.
so it's decreasing again.
thanks for the heads up, my friend @technerd888
No problem, @ashikstd! Hope it helps you in case you are also into trading.