
This is probably the final one of a short series of posts which attempt to document the Sincerity Lab functionality. It will make more sense if you read part 1 and part 2 first.
To get started in using the tool visit https://steem-sincerity.dapptools.info/lab, and click 'Existing User Log In'. Use demo/demo as the account name and password.
In the last post, I briefly described how you can use Steem Sincerity Lab to examine your followers and the people you follow, but thought I should cover this aspect in more detail.
Please remember that this Sincerity data only covers 'active accounts' which have commented or voted in the last 14 days. This probably gives a better reflection of your number of real followers, but will be lower than the number shown on Steemit.com.
When making a scatter plot, you can select the two data fields you want to use for the X and Y axes using the dropdowns (see part 2 for more info about what the fields represent).
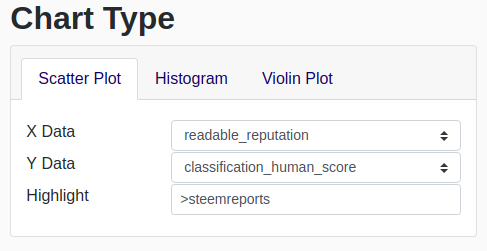
You can use the 'Highlight' field in any of the following ways:
Highlight: andybets
Adds one red highlighted point showing where (in the data) the account is.
Highlight: andybets, steemreports, ionlysaymeep
Adds three red highlighted points showing where (in the data) each of the listed accounts are.
Highlight: >andybets
Read as 'following andybets'. This adds highlighted points showing each of the accounts following andybets.
Highlight: andybets>
Read as 'andybets is following'. Adds highlighted points showing each of the accounts andybets is following.
Highlight: |andybets
Read as 'blocking andybets'. Adds highlighted points showing each of the accounts ignoring/muting andybets.
Highlight: andybets|
Read as 'andybets is blocking'. Adds highlighted points showing each of the accounts andybets is ignoring/muting.
To show only the accounts you selected, without other Steem accounts for comparison, move the 'Sample Size' slider down to 0 before creating the report.
As with all the data that can be presented as a chart in Steem sincerity, the first 25 rows of this data can also be seen in the table below the chart, with clickable links. The whole dataset can be downloaded using the link at the bottom of the page, for further analysis in a Spreadsheet.

The table sorting is based on the 'Y Data' and is in descending order.
Please let me know if you have any questions or suggestions about this tool.
Congratulations! Your post has been selected as a daily Steemit truffle! It is listed on rank 12 of all contributions awarded today. You can find the TOP DAILY TRUFFLE PICKS HERE.
I upvoted your contribution because to my mind your post is at least 21 SBD worth and should receive 61 votes. It's now up to the lovely Steemit community to make this come true.
I am
TrufflePig, an Artificial Intelligence Bot that helps minnows and content curators using Machine Learning. If you are curious how I select content, you can find an explanation here!Have a nice day and sincerely yours,

TrufflePigCongratulations @andybets! You have completed some achievement on Steemit and have been rewarded with new badge(s) :
Click on any badge to view your Board of Honor.
To support your work, I also upvoted your post!
For more information about SteemitBoard, click here
If you no longer want to receive notifications, reply to this comment with the word
STOP