
Moving averages is created to help traders to have a bigger picture of the chart pattern. Most chart pattern show a lot of variation in price movement. This can make it difficult for traders to get the general picture of a stock overall trend.
A moving average reflects the average value of the data in its time window. A 5 day MA shows the average price for the past 5 days, a 20 day MA for the past 20 days and so on.
Simple MA calculation :
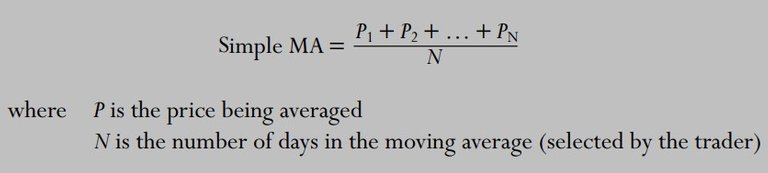
The level of a moving average reflects values that are being averaged and depends on the width of the MA window. Suppose you want to calculate a 3-day simple moving average of a stock. If it closes at 19, 21, and 20 on three consecutive days, then a 3-day simple MA of closing prices is 20 (19 + 21+ 20, divided by 3). Suppose that on the fourth day the stock closes at 22. It makes its 3-day MA rise to 21—the average of the last three days (21 + 20 + 22), divided by 3.
Drawback
The bad thing about MA is that skew heavily when there's an outlier in the data. Let's say for example, a stock hovers between 80 and 90, and its 10-day simple MA stands at 85 but includes one day when the stock reached 105. When that high number is dropped at the end of the 10-day window, the MA will dive, as if in a downtrend. That meaningless dive has nothing to do with the current trend.
Solution for these is EMA (Exponential Moving Average). I'm not going to talk more about this.
How to Trade?

Golden cross is a bullish breakout pattern from the old bearish trend. This happen when there's a cross between a short term moving average (15 days and so on) and a long term moving average (say for 200 days and so on).
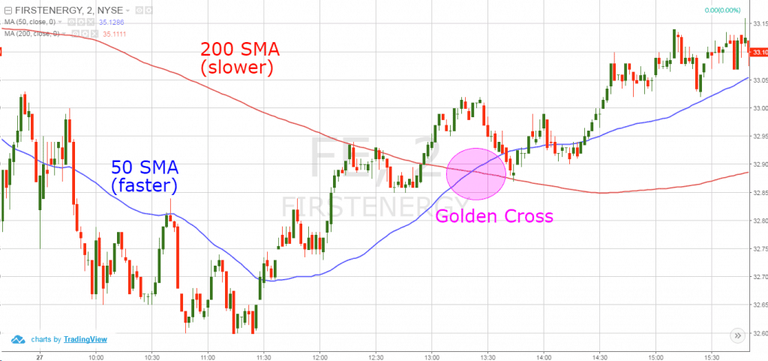
There are 3 stages to a golden cross.
- First stage is the downtrend that are nearly in depletion.
- Second stage, shorter moving averages forms a "GOLDEN CROSSOVER" over the large moving averages to trigger a breakout and bullish confirmation.
- Third stage, continuation of price rise
Typically, moving averages used are 50 days and the 200 days moving averages. Generally, larger time increment provider stronger data and lasting trends. Golden cross resonates perfectly with the motto rising tide lift all the boats. THe rising tide here refers to the 50 day moving average while the boats are the 200 days moving averages.


A death cross is a crossover from long term moving average breaking above its short term moving average. It signifies downward market trend. As long term moving average carries more weight in data, the trend indicates there's an incoming bearish market and is confirmed by high selling volume.
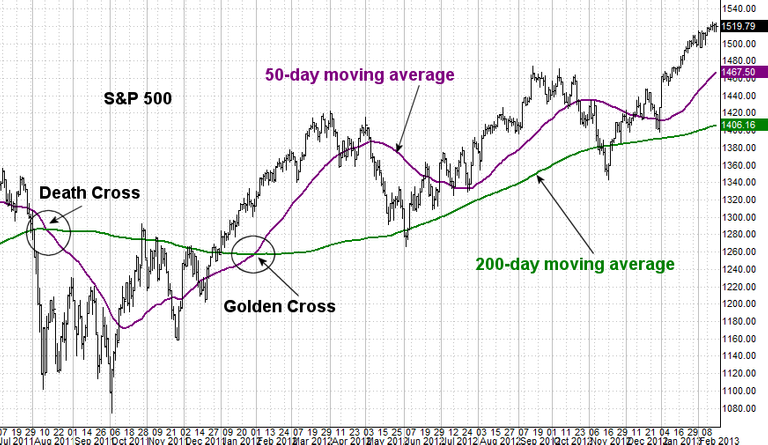
From this example, we can see that a death cross is formed in the August 2011 for S&P 500 stock. The 200 day moving average break above the 50 day moving average and intersect at the point called the "death cross". This indicates for a momentarily bearish market but followed by golden cross afterwards with longer bullish market.
CONCLUSIONS
From this example, we can say that crossovers are not a fool proof investment strategy. But it provides trader with useful support and resistance points and are very easy to use. The most common time frames that are used when creating moving averages are the 200- day, 100-day, 50-day, 20-day and 10-day. The 200-day average is thought to be a good measure of a trading year, a 100-day average of a half a year, a 50-day average of a quarter of a year, a 20-day average of a month and 10-day average of two weeks.
Additional explanation video :

Good explanation.
Thanks for reading mate! Look forward yours too :D