I have done this analysis more than 5 years ago and now I updated with comparative 2018 audited financial data.
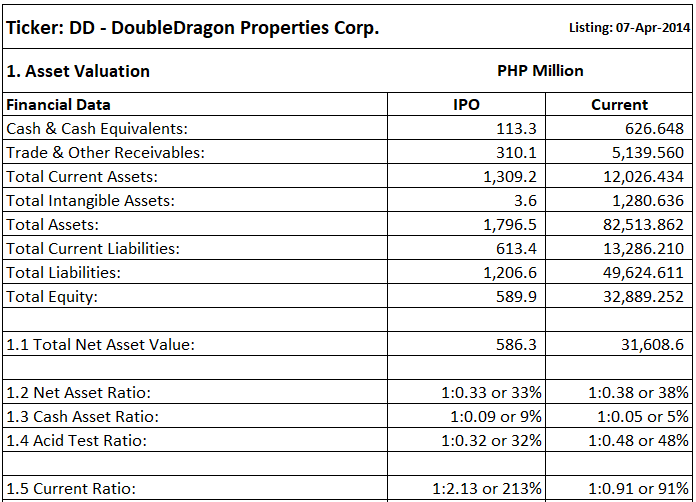
In items 1.2, 1.3 & 1.4, the minimum benchmark for these ratios should be greater than 1 or 100%. But companies in different industries have different needs, so acceptable ratios differ from one industry to another. For the property industry, the ratio that falls below 1:0.75 or 75% is below norms. Mark: Failed.
Current Ratio: 1:2.13 or 213% is within norms in this industry. A minimum benchmark for the current ratio is 1:2 or 200%. This means that a firm has the ability to cover its current liabilities in the short term. But then again, companies in different industries have different needs for liquidity. So acceptable ratios differ from one industry to another. Any current ratios of less than 1:1.75 or 175% for any industry is below standard. Mark: Passed.
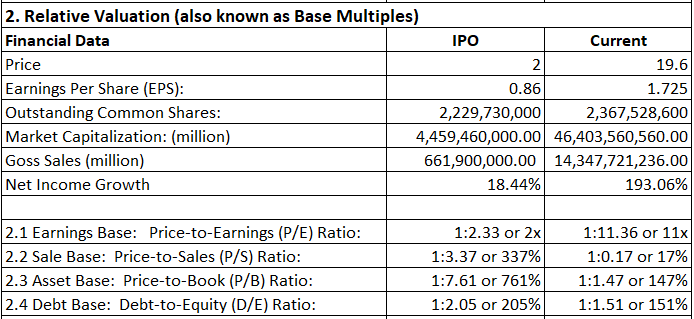
P/E Ratio: 1:2 or 2x. Most common P/E for any industry as follows: Below 12x is cheap, 12x-25x is standard and above 25x is very expensive. Mark: Passed.
P/S Ratio: 1:3.37 or 3x. The lower the P/S ratio, the more attractive the investment. Price-to-sales provides a useful measure for sizing up stocks. For this industry sector, P/S ratio at this level seems laggard. Mark: Failed.
P/B Ratio: 1:7.61 or 8x. A lower price-to-book ratio could indicate that a stock is undervalued. Again, these vary from industry to industry. However, most value investors may often consider stocks with a P/B value under 3x as their benchmark. Mark: Failed.
D/E Ratio: 1:2.05 or 2x. Acid test ratio measures the ability to pay short term liabilities while D/E ratio measures for the long-term leverage. Higher leverage ratios tend to indicate a company or stock with higher risk to shareholders. Investors will often modify the D/E ratio to focus on long-term debt only because the risk of long-term liabilities are different than for short-term debt and payables. Capital-intensive industries such as manufacturing, and telecom tend to have a debt/equity ratio above 2, while tech or services firms could have a typical debt/equity ratio under 0.5. For real property investment, this ratio level is outstanding. Mark: Passed.

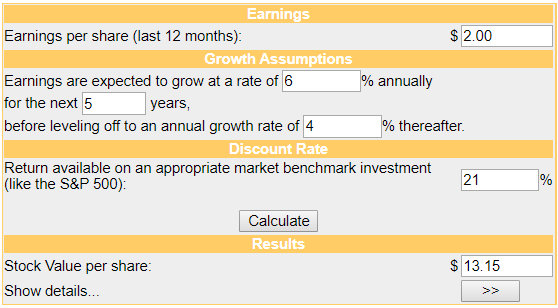
IPO DCF Values:
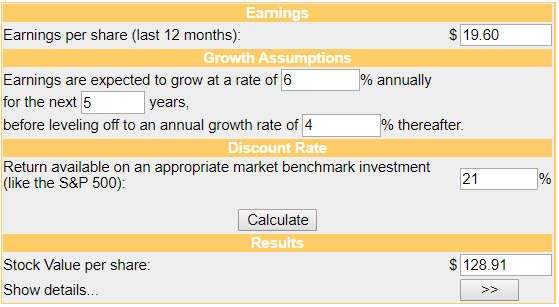
2018 DCF Values:
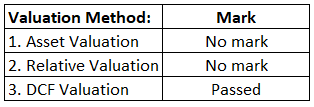
Based on the DCF calculator, this IPO valued at PHP 13.15. My assumption here is within the global industry standard. Property is a risky investment. It’s an interest-driven risk. The higher the interest rate the risky the investment. The global interest rate is 4-5%. In Philippine setting property interest rate is higher at 6-7% vary from institution to institution. Why discount rate at 21%? The Philippine interest rate usually at 7%, this should be doubled for the market risk rate and add another 7% for market risk premium, which totaled 21%. Mark: Passed.
My conclusion:
On the debut day, 07-Apr-2014, the open price at 2.40, high at 3.00 then low and closed at 2.40.
Although in passing mark only on DCF valuation, it is worth noting that 2018 P/E Ratio is at 11x also way undervalued.
If you invest at its IPO price of 2.00 and you hold it until 29-Nov-2019 at its close price of 19.60, you have a substantial paper gain of 850%. Now the question remains if you invest today at the price of 19.60, is it really worth 128.91 after 5 years? If you look at the analysis above, the answer of course is it depends on the person interpreting these results. But then again, is the above numbers the same, better or worst 5 years from today?
After all, there are no right or wrong valuations, it all depends on your risk tolerance and your due diligence.
DISCLAIMER: I'm not a Certified Financial Planner. Published herein is my personal opinion and should not be construed as a recommendation, an offer, or solicitation for the subscription, purchase or sale of this security.