Important Notes:
- I update the zones of my tradingview charts every morning.
- I make daily zones (green boxes) and 1h zones (blue boxes).
- I am a scalp to swing trader. I often look at the following timeframes: 15m, 1H, 4H, 1D.
- I only observe/trade two Forex pairs: GBPAUD (British Pound vs Australian Dollar) and XAUUSD (Gold vs US Dollar).
- I journal both my losing and winning trades.
- I don’t claim myself as a guru. I am still working on refining my strategy. Thus, whatever you read here shouldn’t be taken as a piece of financial advice.
Note: A zone is a premium price area in which no one wants to give up the price. Zones usually serve as strong areas of support and resistance. Therefore, the price is expected to move from one zone to another.
Gold had an unstoppable bullish momentum for the past weeks. Before showing the price actions I saw after zooming the charts out, let me just share the trade I took last Thursday:
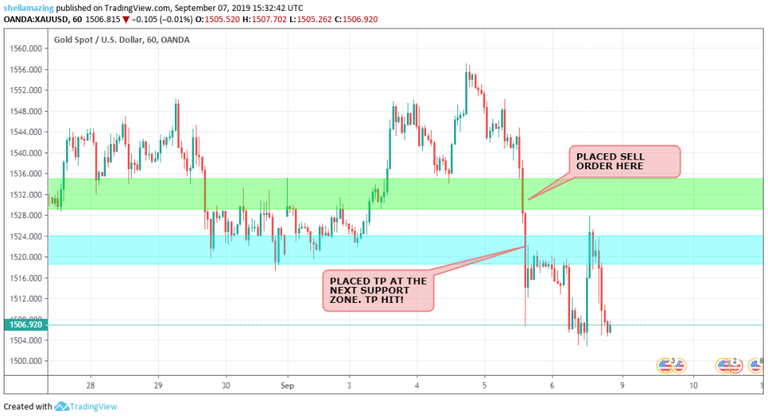
XAUUSD on 1H timeframe
The price went bullish the day before I took this trade. My initial bias was a BUY order, but after seeing that the price broke the previous support (above the daily green box zone), I placed a SELL order. I then set my target price at the next support. It was hit an hour after placing my order.
The chart above is on a one-hour timeframe. Now, let me zoom it out to monthly timeframe.

XAUUSD on monthly timeframe
As you can see, the price is currently on a strong resistance zone. Such zone acted as strong support until it broke down last 2013. Now, we are revisiting such price range. The latest candle (red candle) tells us that there is already a rejection of the bullishness XU experienced for the past months. If the price will get rejected on this particular zone, then we’ll expect for it to go south.
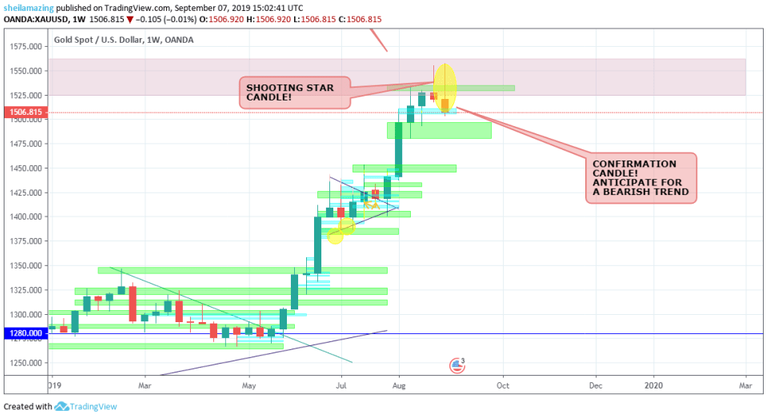
XAUUSD on weekly timeframe
On a lower weekly timeframe, the previous candle closed with indecision, creating a shooting star. The next candle (latest candle) serves as the confirmation candle for XU’s next move. As you can see, there is a strong rejection in the monthly zone (purple box), and the candle ended up bearish. So we’ll be expecting an overall downturn of XU’s trend.

XAUUSD on daily timeframe
Lastly, on the daily timeframe, we’re still seeing a bearish momentum, creating a confluence with the higher timeframes. I’m expecting the price to touch the daily zone (green box), retrace a bit, then continue its downward movement. Its next target might be the next daily support zone. Otherwise, the price will still try to push a little bit higher to retest the previous resistance.
When you are trading, it is very important to look for confluences on different timeframes to confirm the trend. I already learned from my previous trading experiences to always look at the bigger picture.
PS: The reasons why I am having this online journal can be found here:
Officially Documenting My Trading Journal Online
Posted from my blog with SteemPress : [https://pinayteenvestor.com]