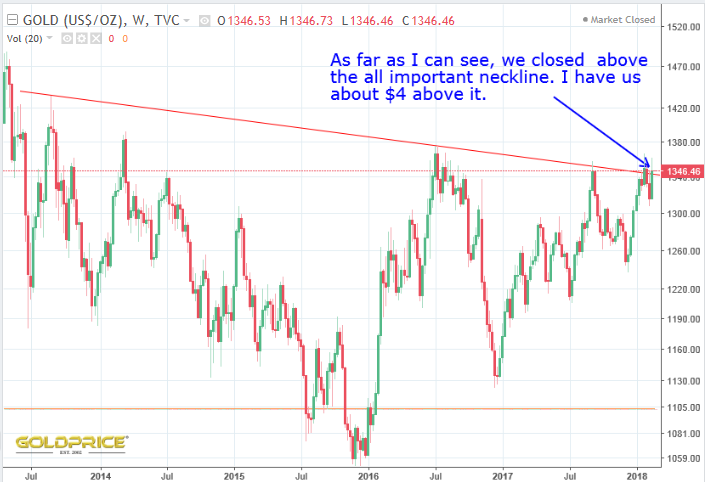
So if we look at the log chart of gold, it looks to me as if we just closed above the neckline. It’s very close, and other scales/software may show us just on, or even below it. The next week or two will tell us all we need to know.
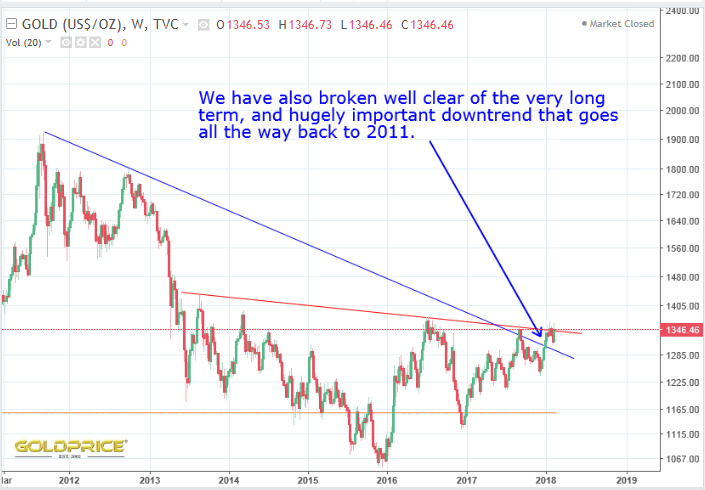
Much clearer though, is the (very bullish) fact that we are now through the long term resistance from the 2011 top.
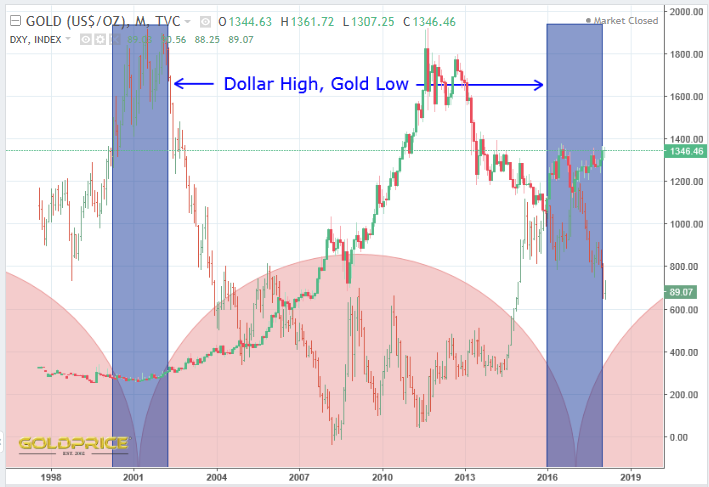
Cycles purists won’t like my next chart, because, I’ve merged the dollar and gold cycles and fiddled about with them a bit, in order to make a more general point. There is a relatively short ‘time zone’ at these cycle lows, where gold finds a low, and the dollar finds it top. As far as this current cycle is concerned, that has just happened. This implies a lower dollar and higher gold going forwards.
To finish off with, I’ve taken a closer look at the dollar chart, and applied some lessons from the past to see where we’re likely to be going. Fascinating to see how the moving averages behave at the dollar top and how our current position compares to the last 2 dollar cycles. Our timing in the cycle is perfect, the moving averages and TRIX are about to confirm beyond any reasonable doubt that the dollar is in a bear market. Our angle of descent is similar to past occasions and if timings are similar, we should see TRIX bottom in early 2019, taking us to around 65 on the dollar index (where the red descending line finds itself at the TRIX low early next year), followed by choppy action and a final low of 55-60.
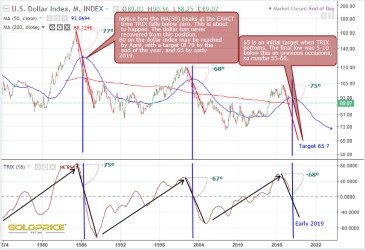
A final comment. The lower highs and lower lows on the dollar index indicate a dying currency. Either we see the trend turn up in the next cycle, or the dollars world reserve status is coming to an end.
Good analysis. Even though we are off the gold standard, It's cool seeing gold keep everything in check behind the scenes.