Rheology and Temperature-Dependent Viscosity of Honeys
Abstract
Some household honeys are known to exhibit interesting ‘non-Newtonian’ properties. One such property is a viscosity (often thought of as ‘thickness’ or resistance to pouring) prone to change depending on the conditions in which it is kept. Storage temperature and physical disturbance are two factors known to affect the viscosity of certain honeys. By treating a spherical ball-bearing descending through honey as a particle and the honey as a fluid exhibiting laminar flow, and making a number of other assumptions, data can be acquired for use in Stokes’ equation. This equation uses simplified Newtonian mechanics to equate upward and downward forces at terminal velocity, relating the time taken for travel through a honey sample to its viscosity. Since non-Newtonian behaviour is observed and the ideal-world assumptions required are not strictly obeyed, results derived using Newtonian mechanical are considered approximate models.
The aim of this project is to investigate the rheological properties and the effect of temperature on the viscosity of honey by comparing two different types (clear honey and heather honey).
Graphical and computational analysis of clear and heather honey finds evidence of a linear inverse relationship between force applied over time and viscosity in clear honey, a property termed ‘thixotropy’. Analysis also strongly indicates an inverse, non-linear relationship between temperature and viscosities for both honeys, with viscosity affected most within the lower temperature interval of 20 ⁰C - 30 ⁰C.
Unexpected and inconclusive results are also yielded; determination of their origin involves review of the experimental method and possible causes of unanticipated behaviour.
Background
This investigation is centred around the rheology, the study of flow, particularly in materials with both fluid and solid properties. Such materials are considered non-Newtonian fluids: their viscosities, measures of resistance to deformation under stress, change under stress, unlike Newtonian fluids which, at constant temperatures, have constant viscosities under stress and are accurately described by Newton’s Law of Viscosity (Fig. 1). Fluids obeying this law experience a shear stress between layers which is proportional to the negative value of the velocity gradient between them .
Fig. 1 Newton’s Law of Viscosity approximates the behaviour of Newtonian fluids.
Non-Newtonian fluids fall into one of two categories: shear thickening (pseudoplastic) and shear thinning (dilatant) fluids, which respectively increase or decrease in viscosity with instantaneous stress (Fig. 2).
Rheopectic and thixotropic substances, types of shear thickening and shear thinning fluids, increase/decrease in viscosity with stress applied over time and do not depend solely on the magnitude of the force (Fig. 3).
Fig. 4 shows the constant viscosity given by a graph of stress against rate of strain in Newtonian fluids compared to the non- constant viscosities of dilatants and pseudoplastics.
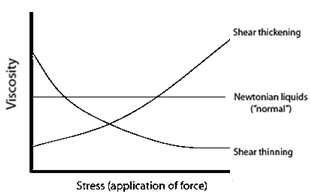
Fig. 2 Viscosity as a function of stress in Newtonian and non-Newtonian fluids.
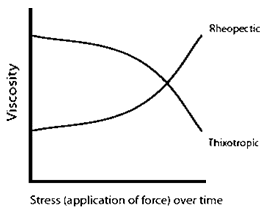
Fig. 3 Viscosity as a function of stress over time.
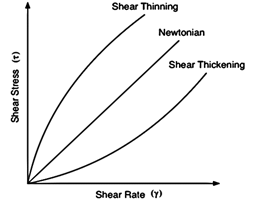
Fig. 4 Shear stress τ against shear rate γ, where γ = - du / dy.
Honey is the product of bees’ conversion of nectar, a watery solution of sugars gathered from plants mainly comprising fructose, glucose and sucrose, into a supersaturated solution of fructose and glucose. Sucrose in the nectar is inverted in a hydrolysis reaction catalysed by the bee-produced enzyme invertase (Fig. 5) and the resultant ‘crude’ honey is regurgitated into cells within the hive.
Enzyme-catalysed inversion of disaccharide sucrose to glucose and fructose by hydrolysis results in a mixture of monosaccharides which, along with the water in which they are dissolved, constitute over 95% of the honey produced (the high sugar content is responsible for many of honey’s properties, including those involving viscosity).
The water is left to evaporate, encouraged by the fanning of wings; the product, honey, comprises around 80% sugars, mostly monosaccharides after inversion, and 16-18% water .
The attraction due to hydrogen bonding between the water and sugars is responsible for honey’s viscosity and ‘stickiness’. It is also the cause of honey’s hygroscopicity (tendency to absorb surrounding moisture) which, coupled with a low average pH of 3.9 , hinders bacterial growth, making some types of honey useful in medicine; Manuka honey, made from nectar of New Zealand’s Manuka flower, has been clinically trialled as a topical treatment for surface wounds and burns. It is this antibiotic character that gives honey its well-known long shelf life.
Honeys of different types have varying sugar concentrations since the nectars of different flowers from which the honeys are derived are compositionally different. It is reasonable to expect that different honey types may therefore have differing viscosities and rheological properties.
Experimental
Part 1: Thixotropy
To measure the effect of force applied over time on viscosity, Part 1 of the experiment involved disturbing (stirring) samples of two honeys, clear and heather, for different lengths of time before their viscosities were tested. The viscosity of the honey was indirectly measured in this experiment by timing the descent of a ball-bearing within a 10 ml measuring cylinder of honey. The mass of the bearing was found using a top-pan balance to be 1.05 g and its diameter, using a calliper, to be 6.36 mm. The diameter of the cylinder, again using a calliper, was found to be 12.94 mm. These measurements were taken to later determine densities and allow viscosity calculations.
The first sample of each honey was left undisturbed. 3 repeat descents were then timed for the clear honey, between which the ball-bearing was recovered by running a magnet along the cylinder’s length. For experimental consistency, the stopwatch was always started as the ball-bearing contacted the honey’s surface and stopped as it touched the cylinder’s bottom; care was taken to avoid contact with the side of the cylinder during the descent as this noticeably slowed the ball-bearing’s descent during practice runs. After a complete set of readings were taken for the sample, the cylinder, ball-bearing and stirring rod were washed with detergent, rinsed with acetone and allowed to dry before the next sample was stirred, to avoid old honey batches or water diluting future samples.
The same tests were then performed and their results recorded for the heather honey, and the same washing procedure carried out afterwards.
A new clear honey sample was stirred vigorously by hand for 30 seconds, after which 3 repeat descents were timed in the same way. Once the equipment had been washed, the corresponding heather sample was stirred and tested.
The next pair of samples were tested after 60 seconds of stirring, another after 90 seconds and the last after 2 minutes.
Descents were timed immediately after the sample was stirred to provide the most accurate results; a sample was not disturbed until a complete set of readings for the previous sample had been taken and preparation for the next set of descents had been carried out.
Part 2: Temperature-dependent viscosity
During this part of the experiment, care was taken to avoid disturbing the honey samples, to ensure that the collected data reflected the effect of temperature, rather than force over time, on viscosity.
Two samples of each honey were warmed in a water bath set at 20 °C for approximately 15 minutes, and one sample was then transferred into a measuring cylinder. 3 repeat ball-bearing descents were then timed and recorded, using the method in Part 1, before the second sample was removed from the bath and the same tests were performed. Washing and drying of the ball-bearing and cylinder between the testing of different samples was carried out as per Part 1.
Leaving the sample of the second honey type in its water bath while the first honey type was tested reduced the extent to which the honey cooled before descents were timed.
A second pair of honey samples was then placed in the water bath, this time set to 25 °C. 10 minutes was allocated to allow the water bath to reach the new temperature, and another 5 minutes to ensure that the immersed honey achieved thermal equilibrium with the water. The samples were again one-by-one removed and their respective descents timed.
These steps were repeated with pairs of honey samples at temperature intervals of 5 °C up to 50 °C, each time allowing 15 minutes upon adjusting the water bath setting before removing the sample and rigorously washing and drying equipment between tests of different samples.
Computational
These experimental methods yield results in the form of a time (time of descent). To observe the effect of our independent variables, force over time for Part 1 and temperature for Part 2, on viscosity, an equation must be used to calculate viscosity as a function of this variable t.
One such equation is Stokes’ Law (Fig. 6), which takes the velocity gradient at each infinitesimal area of the ball’s surface and integrates it to yield the following results: the drag force F on spherical particle of radius r moving through a fluid of viscosity η at speed v is given by the equation:
Fig. 6 Stokes’ Law for a particle moving through a viscous fluid.
To be noted is that most applications of ideal equations when modelling real-world problems in complex fields such as fluid dynamics involve assumptions. This law can be applied only if the following assumptions associated with the law are made about the falling ball-bearing and honey:
- The ball-bearing is modelled as a perfectly spherical, rigid particle.
- The honey is an incompressible fluid.
- The velocity of the ball-bearing is constant throughout its descent.
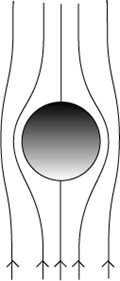
- The honey is uniform in composition and the flow is laminar (there is no disruption between layers); factors such as differing temperature throughout the honey, or the cooling of honey during a descent, could affect viscosity at points enough to prevent flow being considered laminar.
- There are no other particles which would interact to affect flow pattern; the velocity of air at the ball-bearing’s surface at every point during the descent is also zero.
(  )
)
Fig. 7 Stokes’ Law requires a number of assumptions to be made about the properties of the materials and the laminar flow during descent as shown graphically above.
By also assuming that the ball-bearing is travelling at terminal velocity throughout the descent, whereby the net force acting on the bearing is zero, the total downward force on the bearing can be equated to the drag force F:
Density ρ [ball] = mass [ball] / volume [ball] = 7800 kg m ^ -3
Density ρ [honey] = mass [honey] / volume [honey] = 1460 kg m ^ -3
The radius of the ball-bearing = 6.36 mm as measured in the Experimental section.
Rearranging the equation gives:
Replacing velocity v with d / t in the equation, thereby assuming that the motion of the ball-bearing is directly downwards as well as constant throughout, we find that:
Fig. 8 Stokes’ Law rearranges to give viscosity of honey as a function of time of descent, at fixed temperature. The variable d is the height of the descent, calculated, using the diameter and volume measured in the Experimental section, to be 7.60 cm. Viscosity "η" is dimensionally found to have units kg m (s ^ -1), which is the SI derived form of the Pascal-second (Pa∙s).
Above is the honey’s viscosity η given as a function of the time of descent t of the ball-bearing, and shows them to be proportional. As expected, the longer the time of descent, the more viscous the honey sample.
The equation in Fig. 8 was applied to the raw data collected (see Appendices 2-3) to obtain values for viscosity and these are the data tabulated and graphed in the Results section. A data-book value for g of 9.807 m (s ^ -2) was used throughout when calculating data to be tabulated, always to 3 decimal places to avoid rounding errors.
Results and Discussion
Part 1: Thixotropy
Table 1 Average computed viscosities η of clear honey and heather honey versus the period stirred t.
| Time stirred t / s | Average viscosity η of clear honey sample / Pa∙s | Average viscosity η of heather honey sample / Pa∙s |
|---|---|---|
| 0 | 19.08 | 19.20 |
| 30 | 16.61 | 18.49 |
| 60 | 11.77 | 19.81 |
| 90 | 10.92 | 18.10 |
| 120 | 13.28 | 16.82 |
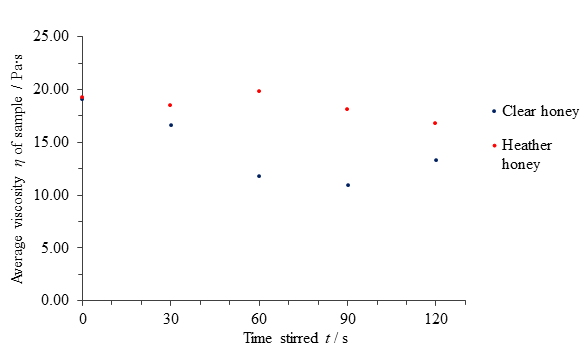
Fig. 9 Figure showing average viscosity η of samples of clear and heather honey versus the time t for which it was disturbed.
The results for clear honey suggest a thixotropic nature up to a disturbance time of 90 seconds, after which further applied force appeared to increase the sample’s viscosity in all 3 tests (see Appendix 2). If one were to disregard the fifth data point average for clear honey as erroneous or
anomalous, or even to simply consider the honey’s behaviour up to 90 seconds of
force separately from its behaviour thereafter, the data provides a good fit to the regression line, clearly showing thixotropic character (Fig. 10). A coefficient of determination value, representing the variance in the dependent data accounted for by the independent data, of 0.942 (close to 1) supports the notion that the change in time stirred is responsible for the viscosity change, although the small number of data points calls the validity of these results and regression data into question.
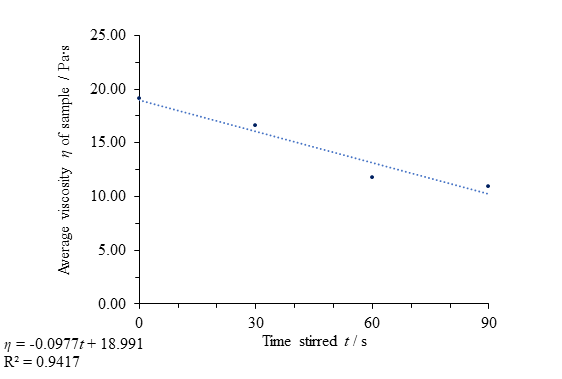
Fig. 10 Figure showing evidence for the thixotropic behaviour of clear honey with applied force up to a period of 90 seconds by comparing time stirred to average viscosity η.
Regarding the sudden change in behaviour of the honey at 120 seconds of stirring, several factors could be responsible; it is possible that stirring for long periods of time could introduce enough air bubbles to significantly disturb the laminar flow of the honey. This non-homogeneous honey would no longer be appropriately modelled, even approximately, by Stokes’ law, as its associated assumptions are violated. Extended disturbance of the honey may even encourage a change in the chemical composition of the sample in the form of a reaction, which could change the sample’s physical behaviour.
Another possibility is that the entire batch of clear honey from which the tested sample was taken was contaminated with a different honey type by other working parties in the lab, or otherwise physically affected by conditions such as moisture or fluctuating temperature having been open hours.
The results obtained for heather honey show little evidence of thixotropy. A regression line fit to the data shows a weak downward trend in viscosity with disturbance, but the data point at 60 seconds along with a low coefficient of determination value means that much more data would need to be gathered to confirm the connection.
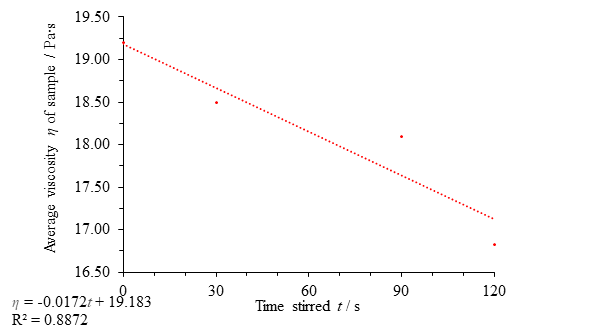
Fig. 11 Figure showing average viscosity η of the sample against time stirred t, with the omission of the data point at 60 seconds. There is less thixotropy evident for heather honey than clear honey, even after omission of an anomalous point.
If, as in Fig. 10, the 3rd data point is considered the result of an error, the data suggests a thixotropic effect (Fig. 11). Although the downward trend is slight, a coefficient of determination value for the data of 0.887 is evidence in favour of thixotropy; however, any conclusion of thixotropy in heather honey is far less convincing than the evidence provided for clear honey thixotropy, both in the degree of thixotropy (size of the viscosity change) and the validity of the assertion that there is a relationship.
Both regression lines fit best as linear equations, supporting a linear relationship between force-over-time and viscosity for clear honey. If at all there is a relationship between the two in heather honey, it is weak and linear.
Comparing the trends and regression data for the two supports this. The standard errors (which measure the accuracy with which the sample mean deviates from the population mean, and gets smaller as the sample grows and becomes a more accurate estimate of the true mean), although all large due to the small number of data points used, can be analysed. The clear honey standard error is by far the largest at 2.390 Pa∙s which shows that, despite the steeper trend and apparent greater thixotropy, the relationship shown by our data is inaccurate and may not represent a relationship at all. When the potentially anomalous data point is discarded, the standard error is still high at 1.154 Pa∙s, whereas the heather honey data with its questionable data point removed gives a much lower standard error of 0.411 Pa∙s, down from 0.919 Pa∙s given by its complete set of data.
These values indicate that, although the heather honey exhibited only a very small degree of thixotropy, its data are most likely more accurate than that of the clear honey samples, and so more confidence can be had in the heather’s results. On the other hand, while one can be less sure of the degree to which the clear honey is thixotropic due to a large standard error (despite an overall strong correlation, one cannot have faith in the accuracy of the slope of the regression line), there is more evidence that clear honey is thixotropic than heather honey.
Part 2: Temperature-dependent viscosity
| Temperature of honey T / ⁰C | Average viscosity η of clear honey / Pa∙s | Average viscosity η of heather honey / Pa∙s |
|---|---|---|
| 20 | 17.33 | 18.43 |
| 25 | 9.10 | 11.64 |
| 30 | 5.20 | 8.63 |
| 35 | 5.18 | 6.92 |
| 40 | 3.88 | 6.33 |
| 45 | 1.95 | 7.51 |
| 50 | 1.49 | 6.60 |
Table 2 Average computed viscosities η of clear honey and heather honey samples versus temperature T.
The average viscosity η of each honey type is similar at 20 ⁰C and decreases in both honeys as temperature increases, but it does so at a decreasing rate as temperature increases; both graphs have the shape of an exponentially decaying graph rather than a linear line. This suggest a negative, non-linear dependence of viscosity upon temperature in both cases. These results make intuitive sense; hot honey pours more easily than cold honey. However, it also stands to reason that the honeys cannot become less viscous forever, eventually becoming ‘runnier’ than water, acetone and air.
The viscosity of heather honey begins to resist change more quickly than that of clear honey, and the rate of change in viscosity as a function of temperature decreases far more rapidly such that their viscosities at 50 ⁰C differ by over 400% compared to just 6% at 20 ⁰C.
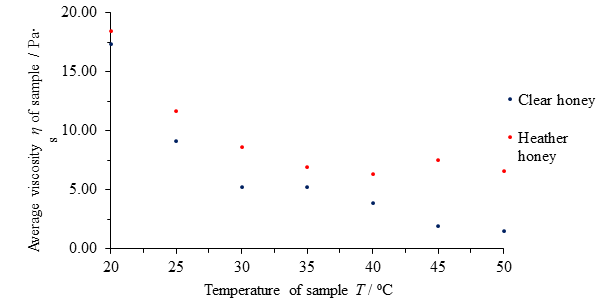
Fig. 12 Figure showing average viscosity η of samples of clear and heather honey versus temperature of sample T.
This could be a result of differing intrinsic physical relationships between temperature and viscosities in the two honeys due to composition. However, it is also possible that the honeys have different heat transfer coefficients and heat capacities; in this case the heather honey may not have reached thermal equilibrium with the water bath in the allotted 15 minutes. The same factors may also have led to the heather honey cooling at a faster rate, thereby being at a cooler temperature than the clear honey samples by the time of testing.
There are many potential sources for error in the data for this part of the experiment. Fluctuations in room temperature, the fact that the temperature of each sample was measured only indirectly by the temperature of the surrounding water, and the variation in time taken to carry out all 3 tests for a given sample are all possible causes for outliers such as the data point at 45 ⁰C for heather honey. When analysing a sample of data which, due to time limitations, is small, it is hard to ascertain whether a fluctuation reflects the physical properties of the honey, external factors or error. Repeat tests were performed on the same sample, so an error associated with the sample itself, such as contamination or inaccurate temperature value, would not be spotted as a random error but would, at least for that sample of honey, be hidden as a systematic error. With more time, it may have been wise to carry out repeat descents using new samples to better determine the difference between a surprising piece of data and an erroneous one, allowing one to more confidently include or discard suspicious data points when analysing.
Conclusion
The data collected provided evidence for a significant degree of thixotropy in the clear honey samples tested, although the data produced a high standard error, making it more difficult to ascertain the extent to which there is a causation. Heather honey, on the other hand, showed less evidence of thixotropy, yielding results with a lower standard error that were likely closer to their true values. This was surprising; heather honey has been shown experimentally to exhibit thixotropy for decades . As discussed, many factors, including methodological shortcomings and external variables, may have been responsible for a relative lack of thixotropic nature.
Both honey types exhibited temperature-dependent viscosity, although again heather honey appeared less dependent, its viscosity plateauing at a far earlier temperature than that of clear honey. Results for Part 2 of the experiment were more conclusive than their thixotropy counterparts, and fewer data points proved hard to explain.
The shortcomings of this investigation lie within the experimental method; there was realistically not enough time to gather the data required to provide conclusive results using relatively cumbersome testing methods, especially while sharing the use of water baths and honey batches with others. While some improvisational experimental changes were made, perhaps more of the method could have been altered ad hoc. For example, when trends in the raw descent timings data began to suggest that samples were either not reaching their desired temperature or
cooling prematurely, steps could have been taken to warm them to the correct temperature before testing. Having said this, time was the limiting factor to repetition, to the detriment of the obtained data, particularly with regard to regression analysis. Working with such a small sample size for each honey type meant that little information could be reliably lifted from coefficient of determination and standard error values. The difference between anomalies/errors and deviating data points was therefore ambiguous, without the necessary number of points to compare to.
A further change that should be made to this experimental method concerns the sampling process; with hindsight, the repeat tests were of limited scientific value since they were testing the same material each time. Errors originating from the physical properties of the sample itself rather than incorrect experimental practice (over/under-disturbance or an incorrectly predicted temperature of a sample, for example) would be replicated and thereafter almost impossible to eliminate without the benchmark of additional data.
Other, more minor, procedural issues include the variation in force applied by hand-stirring from sample to sample and collecting samples with a spoon, thereby disturbing them by applying force, from the original batch shortly before thixotropy tests. Neither of these problems can be realistically addressed given the equipment and resources available, barring perhaps preparing samples ready for stirring days in advance of the experimental session.
Within the limitations of the experimental method, the tests carried out yielded data that showed evidence of some degree of thixotropic and temperature-dependent viscosity in both honey types. While some results, such as the evident temperature-dependence in the honeys, were observed as expected, others, in the case of the heather honey’s thixotropy results, were unexpected and harder to explain. Whether such differences between the strengths of discovered trends were the results of differing chemistries, external physical interaction, fluctuating laboratory conditions, experimental inaccuracies or human error is hard to determine given the number of data, but suggestions have been made about their sources by reflection upon the method and consideration of the difficulties encountered.
References
http://www.columbia.edu/itc/ldeo/lackner/E4900/Themelis3.pdf
http://www.chm.bris.ac.uk/webprojects2001/loveridge/index-page3.html
Science Learning Hub © 2007-2017, The University of Waikato, https://www.sciencelearn.org.nz
Science Learning Hub © 2007-2017, The University of Waikato, https://www.sciencelearn.org.nz/images/1845-thixotropic-and-rheopectic
https://neutrium.net/fluid_flow/viscosity/
http://www.carusohoney.com/id11.html
https://honeybeesuite.com/how-acid-is-honey/
https://www.britannica.com/science/Stokess-law
http://aerosol.ees.ufl.edu/aerosol_trans/section03_b.html
https://phys.libretexts.org/Core/Fluids/1.7%3A_Stokes%E2%80%99_Law
https://phys.libretexts.org/Core/Fluids/1.7%3A_Stokes%E2%80%99_Law
http://www.rheosense.com/basics/viscosity-units
Brian L. Stevens; Frank L. Lewis; Eric N. Johnson Aircraft Control and Simulation: Dynamics, Controls Design, and Autonomous Systems, 3rd Ed., Wiley Publishers, Feb. 2016
G. W. Scott Blair The Thixotropy of Heather Honey, May 2nd 1934
Petr Trávníček; Antonín Přidal Thixotropic behaviour of honey from Eucalyptus SPP, Sep. 14th 2016