Hello, estemmed readers of the HiveSTEM community. It has been a while. It’s so great to be back, not on Steem but Hive. Nice logo and colour mix.
In my last post on Steem, I was discussing the chemistry behind analysing, identifying and separating of substances. I discussed the Nuclear Magnetic Resonance (NMR), Spectroscopy, Using the spectrometer and Chromatography. I explained that chromatography is a process by which components of a mixture can be separated and identified. The name “chromatography” is gotten from two Greek words, chroma which means colour; and the graphe means writing. I wrote that the technique was stumbled across unexpectly and advanced by a Russian botanist, Mikhail Tswett in 1903. I also explained that there are two major types of chromatography and they are the partition chromatography and adsorption chromatography. Examples of partition chromatography are the paper and gas-liquid chromatography while the column, thin-layer and gas-solid chromatography are some of the examples of adsorption chromatography. Now, let’s look at those examples in details, starting with the two-way chromatography.
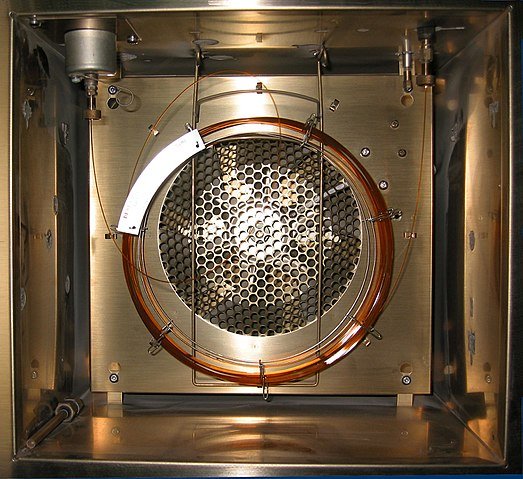
A gas chromatography oven, open to show a capillary column. Polimerek, CC BY-SA 4.0
Two-way chromatography
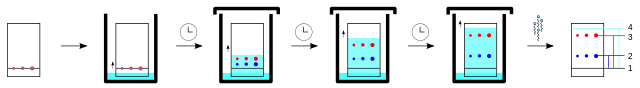
This happens when the components of a mixture are not separated completely because they have similar solubilities in a particular solvent. To overcome this problem the paper is rotated 90° and a different solvent is used to ensure a separation. This process is called two-way chromatography.
GAS-LIQUID CHROMATOGRAPHY (GLC) OR (GC)
An unreactive gas, such as nitrogen or helium, is used as the carrier gas (the mobile phase) in GLC. The stationary phase consists of a liquid coating particles of a finely powdered inert solid. The powder fills a coiled narrow-bore tube called a column. The temperature of the column is controlled by an oven. Typically, the tube that forms the column can be 5 to 10 m long, with a bore of 2 to 10 mm
The vaporized sample is injected into the carrier gas as it streams into the column at an even rate. As the components of the sample are carried through the column, those that are more soluble in the stationary phase move at a slower rate.
Volatile components are carried more quickly than non-volatile ones, which therefore have a greater opportunity to dissolve in the liquid stationary phase. So, the volatile components emerge first from the column.
The time each component remains in the column is known as its retention time. This depends on such factors as the flow rate of the carrier gas, the temperature of the oven, and the length and diameter of the column. Each retention time is characteristic of a particular component, which allows it to be separated and identified. The area under each peak displayed on the recorder is the measure of the amount of that component present. The relative amounts of components in a mixture can therefore be calculated, an operation now done by computer. This leads to the percentage composition of the components of a mixture.
GLC is very sensitive and is able to detect and measure minute amounts of substances. It has therefore become a standard method for detecting banned substances in sport, and for determining the amount of alcohol in a motorist’s blood when it is close to the legal limit. When connected to a mass spectrometer, it is used to identify substances in foods and medicinal plants.
In GLC, a chromatogram is the record of the analysis displayed on a screen. In paper chromatography, it is the components themselves separated on the paper. GLC analysis of blood or urine samples provides a more accurate result than infrared testing of breath, if the breath-alcohol concentration is between 40 and 50 ∞ g per 100 cm3.
Gas chromatography has its limitations:
- similar compounds often have similar retention times;
- unknown components have not been through the apparatus, so there are no retention times that can be used for reference.
REVEALING THE SECRETS OF OLD MASTERS
When you next go round an art gallery and look at the work of a great artist who perhaps lived four or five centuries ago, give some thought to its chemistry. Paint pigments provide the colour, but they do not stick to the canvas or wooden panel on their own. They need to be bound together and to the supporting surface. For some 5000 years before the Renaissance, artists mainly used egg yolk (called tempera) as the binding medium.
Then, in the 1400s, Italian and Flemish artists started to switch to oils that dried, such as linseed, poppy or walnut oil. This is where GLC comes in.
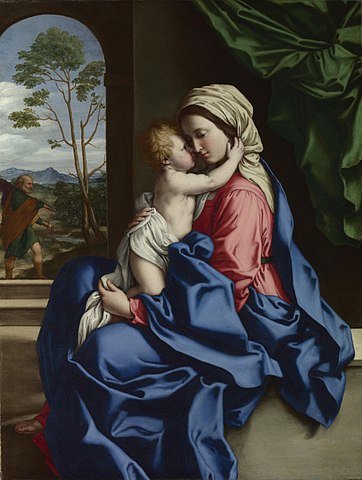
The figure is that of The Virgin and Child Embracing by Sassoferratto (1609-1685), during restoration of the painting
When a gallery wants to restore a painting, it is essential to know what binding medium the artist used. In the oils used, long chain fatty acids are present as esters and these have characteristic retention times in a gas chromatogram. By performing GLC, the different oils used can be identified and then the same oils are mixed with pigments for restoring the picture. Chromatograms of known oils can be compared with the chromatogram of a tiny sample of paint removed from the picture to be restored, to determine which drying oil the artist used.
THIN-LAYER CHROMATOGRAPHY (TLC)
TLC is similar to paper chromatography, except that the stationary phase is a fine, inert powder, such as silica gel, which is made into a paste and spread in a thin, even layer over a plastic or glass plate. The layer of paste is then baked on to the plate. Spots of the mixture are applied near the bottom of the plate. As the solvent rises by capillary action up through the spaces between the inert powder particles, the components of the mixture are carried up and separated. When the solvent is almost at the top of the plate, the plate is taken out and dried. Rf values can be obtained in the same way as for paper chromatography.
TLC has three advantages over paper chromatography: it is quicker, the results are more easily reproduced and the separations are more efficient. The technique is used in industry to follow the course of a reaction by studying which components are present. The separated components can be retrieved by scraping off the spots on the stationary phase and dissolving them in a suitable solvent. TLC is also widely used in forensic science to identify explosive residues and to detect cannabis.
COMBINING TECHNIQUES
As you have seen, the chemist has many techniques to call upon when determining the structure of an unknown molecule, and they hardly ever used in isolation. Gas-liquid chromatography is an excellent way to separate large numbers of components, whereas mass spectrometry is not the instrument to use if you want to identify substances in complex mixtures because the spectra are too complicated. By combining the two techniques, the separation is first carried out by gas-liquid chromatography, and then the separated components are analysed by the mass spectrometer. This is known as GC-MS. GC denotes gas chromotography, and MS mass spectrometry. When the mass spectrum of a compound is obtained it is compared to a database of mass spectra using a computer. This often gives a positive identification of the component. The use of GC-MS is important in forensics, environmental analysis, airport security and space probes.
In the same way, infrared spectrometry gives good evidence of the presence of functional groups, but its information needs to be pooled with that from other techniques to gain the complete picture. Combustion analysis gives information about the percentage composition of elements in a compound by burning a sample in oxygen. The gases produced, such as CO2, H2O and SO2, can be fed directly into gas-liquid chromatography apparatus, where they are separated and analysed, and their amounts determined.
Another example is the combination of NMR, which determines the different environments of hydrogen nuclei, with mass spectroscopy, which gives fragmentation patterns and an accurate Mr. The use of a combination of analytical techniques makes the determination of structural formulas more likely. Further analytical tools are electrophoresis, ultraviolet/visible absorption spectroscopy and atomic emission spectroscopy
CONCLUSION
After studying all the posts I've written on ANALYSING, IDENTIFYING AND SEPARATING SUBSTANCES starting with I, II, III and this, you should know and understand the following that:
Percentage composition by mass of different elements in a compound may be obtained by combustion analysis. Empirical formulas can be determined from percentage composition data. A mass spectrometer separates streams of positive ions according to their masses and charges. Mass spectra of elements can be used to work out accurate values of Ar.
When molecules are ionized in the mass spectrometer, they often break up into fragments that can give information about the structure of a molecule. High-resolution mass spectrometry gives highly accurate values of Mr, which may lead to the molecular formula of a compound. Infrared spectroscopy can be used to identify functional groups that absorb infrared radiation because of their vibrations.
Nuclear magnetic resonance (NMR) spectroscopy gives information on the location and number of hydrogen atoms in a molecule, because spinning protons create a magnetic field. Chemical shift in an NMR spectrum occurs because protons in different chemical environments experience slight variations in the externally applied magnetic field.
Chromatography involves the distribution of the components of a mixture between a stationary phase and a mobile phase, and provides a way of separating compounds.There are several types of chromatography. They include paper chromatography, thin-layer chromatography (TLC), column chromatography and gas-liquid chromatography (GLC).
REFERENCES
https://www.alamy.com/stock-photo/the-virgin-and-child-embracing.html
https://gallerix.org/storeroom/1781292315/N/2963600414/
https://www.pinterest.com/pin/693624780083847908/
Gas-Liquid Chromatography for restoring pictures.
https://www.chemguide.co.uk/analysis/chromatography/thinlayer.html
https://www.chemguide.co.uk/analysis/chromatography/thinlayer.html
https://en.wikipedia.org/wiki/Thin-layer_chromatography
https://www.bruker.com/applications/pharma-biopharma/drug-development/structure-elucidation.html
https://www.ncbi.nlm.nih.gov/books/NBK207662/
https://en.wikipedia.org/wiki/Two-dimensional_chromatography
https://www.chemguide.co.uk/analysis/chromatography/paper.html
https://www.sciencedirect.com/topics/materials-science/two-dimensional-chromatography
https://en.wikipedia.org/wiki/Gas_chromatography
https://www.chemguide.co.uk/analysis/chromatography/gas.html
https://www.sciencedirect.com/topics/agricultural-and-biological-sciences/gas-chromatography
If you appreciate the work we are doing, then consider supporting our witness @stem.witness. Additional witness support to the curie witness would be appreciated as well.
For additional information please join us on the SteemSTEM discord and to get to know the rest of the community!
Thanks for having used the stem.openhive.network app. This granted you a stronger support from SteemSTEM. Note that including @steemstem in the list of beneficiaries of this post could have yielded an even more important support.