How are you doing today? I hope you are having a blessed day. It's been a couple of really exhausting weeks and I have been away for more than fifteen days now. Too many things to handle and only one man over here trying to take care of everything and handle life through some rough times. No free time for me to enjoy nature or to keep publishing work for my Cartography series. However I finally found some space for myself and now I'm ready to produce more material, so here I am with another part of this series. No time to waste though, so let's do this!
As promised in a previous Cartography post concerning the methods and tools used in the symbolization of surface data, this is the seventeenth part of this Introduction to Cartography series. This time I'm taking the chance to continue sharing broad information about the process of map symbolization by focusing on the methods utilized in the creation of precise depictions of volumetric data. We will talk about statistical surfaces and the way point symbols are utilized to represent volumetric data. We will also discuss various symbolization problems that Cartographers often have to deal with, so stay focused!
In case this is the very first time you visit my blog, please keep in mind that this is an introductory series about the sciece and art of gathering measurements and creating precise 2D depictions of our 3D world; Cartography. This actually means that I will be sharing broad information in a simplified manner so that we can have some fun while learning something new. There's always a high chance of learning a thing or two by reading through this blog, so stay tuned!
Symbolization Problems
As explained in the previous parts of this Introduction to Cartography series, the symbolization of point, linear and surface data is a complex process and a very demanding task that requires knowledge related to various scientific fields. Well, trust me when I say that the symbolization of volumetric data is a much more complicated process. That is mainly due to the fact that volumetric data appears, and therefore needs to be depicted, in all types of point, linear and surface data included in the creation of a map. As a result, the utilization of all kinds of symbols (point, linear and surface) for the representation of volumetric data is inevitable, and that is one of the main factors increasing the difficulty levels of this endeavor.
The problems discussed in this blog refer to specific theoretical occasions where the existence of volumetric data on a particular surface of interest has to be represented with precision; in such cases we are dealing with what Engineers call a statistical surface. Most of the obstacles standing in the way of our fellow Engineers are directly related to the methods of symbolization that are mainly followed, which are constantly improved and designed in order to emphasize on particular problems of spatial distribution that need to be solved. The first step is to accurately define the level of measurement (ordinal scale < interval scale < ratio scale), which is a process that was sufficiently described in a previous part of this series.
Once the level of measurement regarding our spatial element's characteristics is defined, the very next step is the selection of primary and (if necessary) secondary visual variables that will do the job efficiently. This task demands theoretical knowledge of the Trichromatic Theory of Color Vision, which by the way was the subject of a previous part of this series as well. See, I've been taking good care of you and doing my best to provide top-notch information after conducting extensive research. Round of applause. It is worth noting at this point that the utilization of patterns created by repetitive symbols is also a part of this step, and that is due to the fact that we are dealing with volumetric data that refers to surfaces of specific dimensions in this blog. Let's proceed to the main menu.

Statistical Surface
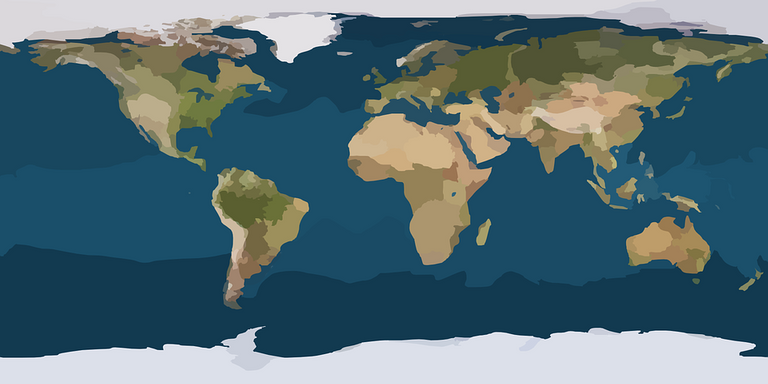
Geographical surfaces have been the primary topic of research and one of the mist favoured topics of scientific discussion between both Carthographers and various types of professionals who depend on mappings in order to handle their business. A continuous geographical surface can be represented and constructed with the utilization of values of different types of characteristics that refer to one of the three levels of measurement mentioned in the previous chapter. The objective of the Cartographer who is responsible for the end product is to efficiently depict and represent the spatial distribution of those values through the creation of a surface pattern.
We should always keep in mind that Cartographers need to always be very wary and careful when deciding what type of symbols (point, linear, surface) should be used in order to serve the map's purpose effectively. As explained previously and multiple times in the past, the key is to define the level of measurement of the spatial elements' characteristics that need to be depicted and included in the information that the end product is supposed to provide to the observer/user. The utilization of dots as point elements is a common phenomenon in the business of creating 2D depictions of the spatial distribution of volumetric data, as it enables Cartographers to create unique patterns that can communicate with the human sensory system a lot more effectively. If I may.
Definition & Nature
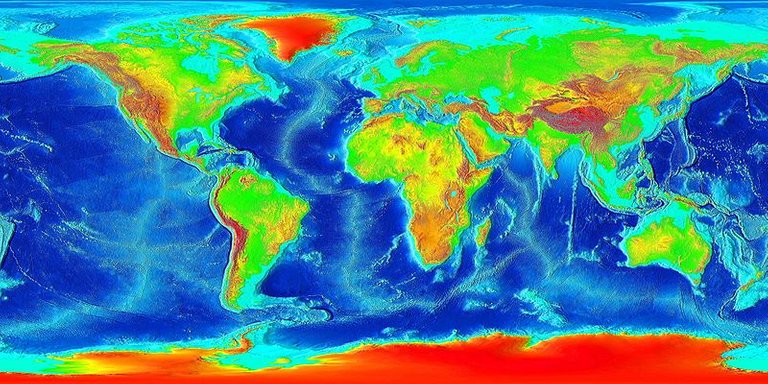
This is one of the most significant terms in the scientific field of creating 2D depictions of our 3D world with accuracy. For every mathematically continuous distribution in the field of Statistical Analysis that is described by one of the three levels of measurement mentioned above, there is a specific statistical surface that refers to an area of particular dimensions. What? To be more precise, in this scenario we are talking about, the entity that we refer to as a statistical surface would look like a huge piece of mass of the Natural Terrestrial Surface if we only keep the outline. In other words, this complicated statistical surface of ours represents the variations of the surface of the geographical entities depicted as a whole.
Statistical surfaces can be designed and defined with the utilization of all sorts of spatial data (point, linear, surface), and therefore all types of symbols are quite frequently used in the symbolization of volumetric data that refers to points, lines or even surfaces on the Natural Terrestrial Surface. The creation of a statistical surface depends on the values of the spatial characteristics measured, and therefore the level of measurement utilized in each case plays a rather significant role in as well. The quantities measured (values of spatial characteristics) can be combined in a unique way so as to create a 3D surface, which provides a smart visual representation of qualitative and quantitative variations regarding the characteristics of a broad group of geographical phenomena.
Statistical surfaces are very useful tools of spatial abalysis mainly due to the way our brains work. This basically means that 3D visual representations of geographical phenomena are way more effective and efficient, which is one of the primary reasons why statistical surfaces are most commonly used in order to depict quantities that refer to the third and missing dimension. Slope of surface, height of rainfall, depth of the seabed just to name a few practical applications. Of course, let us give hue the proper credit, as it is the most significant primary visual variable in this game. Another great asset in the creation of visual representations regarding qualitative or quantitative variations. Note: only quantitative variations described by an interval or ratio scale qualify for this. It was nice having you here.
Alright people, that's it for now. We have officially reached the end of the seventeenth part of this Introduction to Cartography series. I would like to thank each and everyone of you who have been supporting my work all along. You people are a blessing that I hope I deserve. Anyway, let me know in case you have any questions in the comments below and I will respond in detail. More stuff concerning my Introduction to Geology series coming out within the next days, so stay tuned and follow me for more Engineering stuff!
PREVIOUS PARTS OF THE SERIES:

IMAGE SOURCES:
REFERENCES:
University Textbooks & Course Lectures:
- Χαρτογραφία Ι/ Cartography I -TSOULOS(National Technical University of Athens, School of Rural & Surveying Engineering, Course Lecture Notes)
Internet Links:
http://www.esri.com/industries/k-12/education/~/media/files/pdfs/industries/k-12/pdfs/intrcart.pdf
http://webhelp.esri.com/arcgisdesktop/9.3/index.cfm?TopicName=Ways_to_map_quantitative_data
http://www.gitta.info/ThematicCart/en/html/MapSizeScale_learningObject5.html
https://www.keyence.com/ss/products/microscope/roughness/line/roughness-symbols.jsp

Why do you use one eye as your avatar?
You are not the first whom I saw that did it.
At least the third.
You got upvoted from @adriatik bot! Thank you to you for using our service. We really hope this will hope to promote your quality content!
Yeah! All about quality!
No reason in particular, mainly because I can see you :)
This is what I thought that it symbolizes.
You work for an intelligence agency?
You got upvoted from @adriatik bot! Thank you to you for using our service. We really hope this will hope to promote your quality content!
This is the third or fourth skipped vote on my bids.
From now I will abstain from using this bot in principle and from practical reasons until I get a refund.
Once I got a 0.1 refund on a vote that you did not skip, but since then things got worse and worse and now you owe me at least 0.2 SBD.
You got a 14.40% upvote from @sleeplesswhale courtesy of @stimialiti!
Why are you lying mr Bot? You did not upvote their comment.
I work for science.
You got a 100.00% upvote from @luckyvotes courtesy of @stimialiti!
You got a 61.24% upvote from @luckyvotes courtesy of @stimialiti!
Nice Post..!I have done with 100.00% upvote Thanks @stimialiti for sharing the post..!
You got a 50.00% upvote from @sleeplesswhale courtesy of @stimialiti!
This post has been voted on by the steemstem curation team and voting trail.
There is more to SteemSTEM than just writing posts, check here for some more tips on being a community member. You can also join our discord here to get to know the rest of the community!
There is a lot more to SteemSTEM, we are a big family!
Thanks for the constant support :)
ποπο φίλε!!! είναι απίστευτο..... καλό βράδυ
Thank you Nick! Καλό βράδυ!
Hi @lordneroo!
Your post was upvoted by utopian.io in cooperation with steemstem - supporting knowledge, innovation and technological advancement on the Steem Blockchain.
Contribute to Open Source with utopian.io
Learn how to contribute on our website and join the new open source economy.
Want to chat? Join the Utopian Community on Discord https://discord.gg/h52nFrV
Thank you so much for the support, I am honored!
Another great article bro. Ur CARTOGRAPHY series is really informative, didnt knw much about map things before i started reading ur series. Keep this going, bro.
Cheers!
Hello @ied, thank you so much mate for dropping by and leaving a nice comment!
Have a great day!
good day bro!