I thought today was a good opportunity to pull the #charts back to the 1D timeframe to give a nice view of the big picture. For starters, I want to point out how #Bitcoin is respecting/following our #bull trend #support very nicely (brown arrow). Along with that, check out the #volume for the two recent times #BTC test this support. When we bounced off this line around the $6,000 mark, we saw a HUGE volume spike. However, the volume we've been experiencing lately has made it look pitiful (red box-circle things...?). In addition to all of this, our #RSI has been surging nicely with plenty of room for upward potential. Our #MACD is showing a momentum flip as it attempts to cross to the upside. Keep in mind, this is the daily charts, so that MACD turning is actually a really good sign.
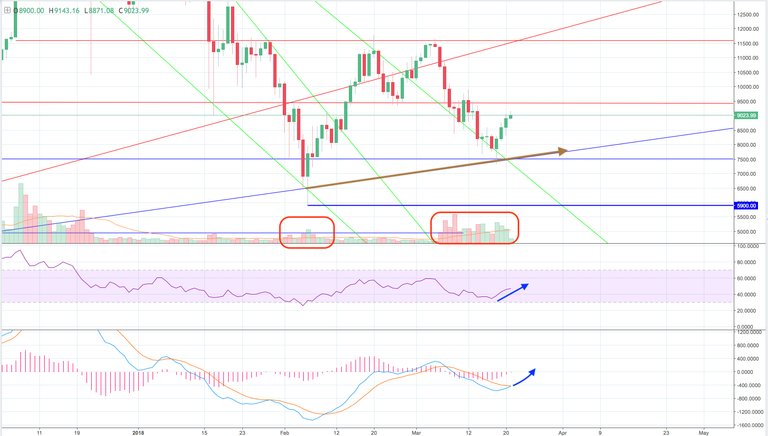
We need Bitcoin to break our $9,500 horizontal #resistance, so we can retest this $11,600 resistance a third and, hopefully, final time. We still have a long way to go, but believe it or not, sentiment about #crypto is improving. More #regulation is actually helping legitimize it as the future of our global culture. We'll see how far the regulation goes, but so far, it hasn't been completely horrible. Many analysts also believe the #bear market for ALT coins is over. They predict an entrance into an area of #consolidation for a little while, then surging in about 120-170 days.
What are your thoughts?