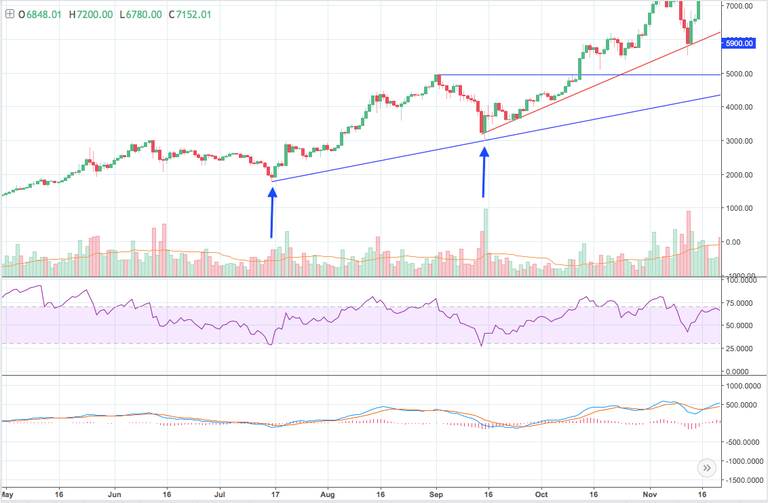
So #Bitcoin's movement yesterday felt a little strange to me. So I looked back on my line drawn showing our previous #bull trend #support. I zoomed in significantly to adjust my line to be as precise as possible. These two support points are what created this current trend that #BTC has been respecting thus far (blue arrows). Check it out:
So when I pulled my normal chart up, our movement began to make a whole lot more sense, and it is also causing me to question whether we will even touch back down to our $5,900 horizontal support. If you look at our last low, I assumed we were reacting off of a horizontal support, but with the adjusted trend line support, it appears to have been respecting THAT line quite perfectly (blue arrow). If that is the true factor here, you can see Bitcoin hovering around that same line now (red arrow). It's not quite as perfect as the last time, but it's definitely a factor here. If this indeed will be the turning point, we need to see Bitcoin breaking our $7,500 level horizontal #resistance (green arrow). If it is not, we could see BTC retesting this resistance, failing, and then finally coming back down to our $5,900 horizontal support (orange arrow). Check it out:
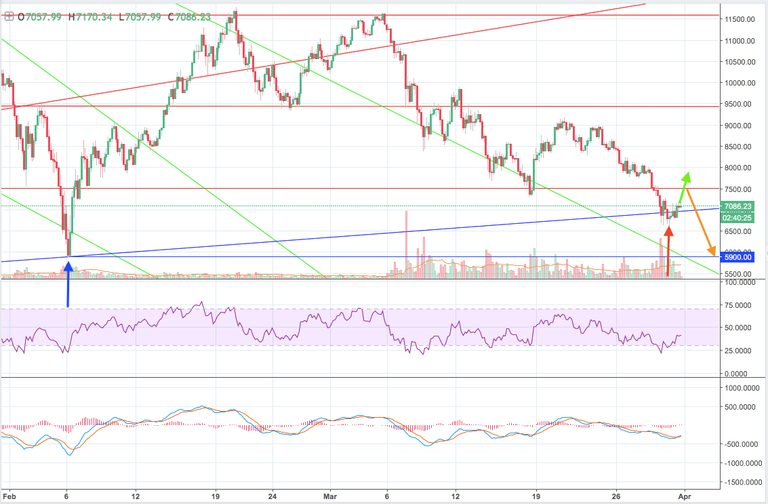
It's honestly really hard for me to tell at this point. I am leaning towards the dip to $5,900 because of a rather weak "bounce" off this trend line support. It was no where near as convincing as our last low. I am personally waiting on some scale in points right now. I was hoping to scale in at $6,500 and $6,000, but if we break above $7,500, I may not get that shot. As always, we have to stay vigilant.
Thoughts?