- EUR forecast: horizontal, Bullish potential
- USD forecast: horizontally, potentially Bearish
- EUR / USD forecast: wait for breakout signal
Fundamental Analysis
This morning, the Chinese government officially imposed import duties on goods from the United States, in exchange for Trump's trade policy last week. Impact, the Dollar Index observed a defensive move in the range of 90's level.
Trade war fears are making investors The dollar should reconsider Long's position on the Greenback since his rally early last week.
Meanwhile, the US will release its employment report (NFP) this week. Dara will be the market's attention, because the results will affect the Fed's consideration in considering the interest rate of the US central bank.
Technical Analysis EUR / USD (H4)
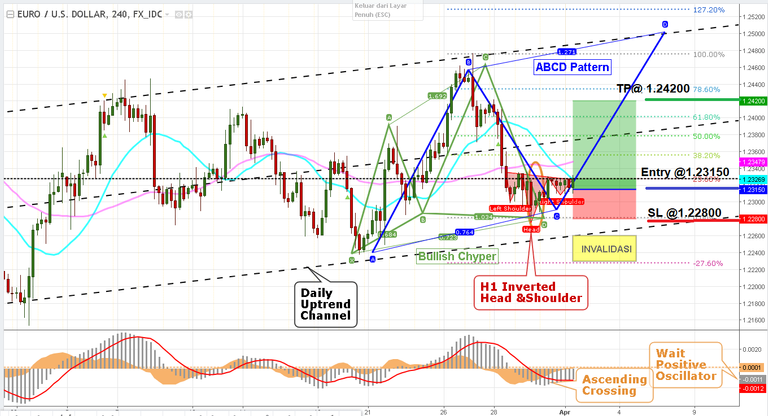
EUR / USD is forecast to move up with an indication of Bullish signals below:
- The Cypher Bullish harmonic pattern signals the potential price to start reversing from its low point at point D. While the movement is projected to continue climbing with a tendency to complete the ABCD pattern.
- Prices are observed to meet the Resistance along the Inverted Head and Shoulders neckline. If the price is able to break the neckline, then the price is likely to rally.
- The brown circle highlights the formation of the Bullish candlestick formation, after the price tries to decline and approaches the Support on the Daily Uptrend Channel.
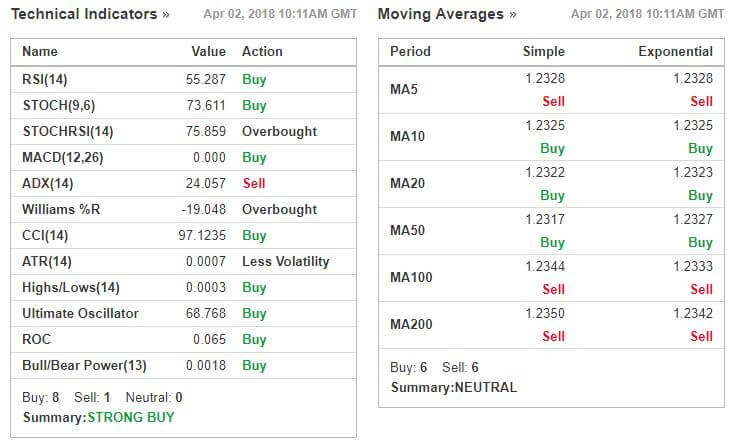
Supporting Indicators
Below is a list of supporting indicators for pair EUR / USD with hourly timeframe (H1). You can use this referral indicator to confirm the signal:
Position Opening Advice
Long Position Scenario (Buy)
- TP: 1.24200 (plus 105 pips / 1050 points).
- Entry: Buy around the 1.23150 level.
- SL: 1.22800 (minus 35 pips / 350 points).
You can execute an instant market order (Buy) or wait for the price to approach the Entry point by using the Pending Order.
From the MACD indicator side, wait until the histogram (MACD line) is moving in a positive direction to confirm the Buy opportunity. Keep the Long position as long as the histogram is still in the positive zone and above the red line (signal line).
Setting Risk / Reward ratio in this position is 3RR. Use trailing stop auto or manual (15 pips or 150 points) to secure position. Use also MM calculator for regular capital management and position is not over lot
The current volatility in global stock and bond markets is driven by the rise in the cost of short term debt. The benchmark 3 month Libor rate has been spiking over the last few months hitting banks and corporations.
The following chart from the Fed shows how the 3 month Libor rate has been spiking.
If this continues be prepared for alot more volatility in global markets.
Your Post Has Been Featured on @Resteemable!
Feature any Steemit post using resteemit.com!
How It Works:
1. Take Any Steemit URL
2. Erase
https://3. Type
reGet Featured Instantly & Featured Posts are voted every 2.4hrs
Join the Curation Team Here | Vote Resteemable for Witness