Sorry no.. you need to zoom out to see more data to decide on your bases.. a base is defined by the bounce it had off of it.. so I will draw some x x x to show you the bounces that are missing, to define your bases.. notice my arrows show you too locations that look the same and dont create a bounce.. .. now i will draw in yellow the real bases and the safe circles to buy in..
hope this helps.. pls dont forget to zoom out and look at a 1 to 2 month picture of the stock to see the bases easier..
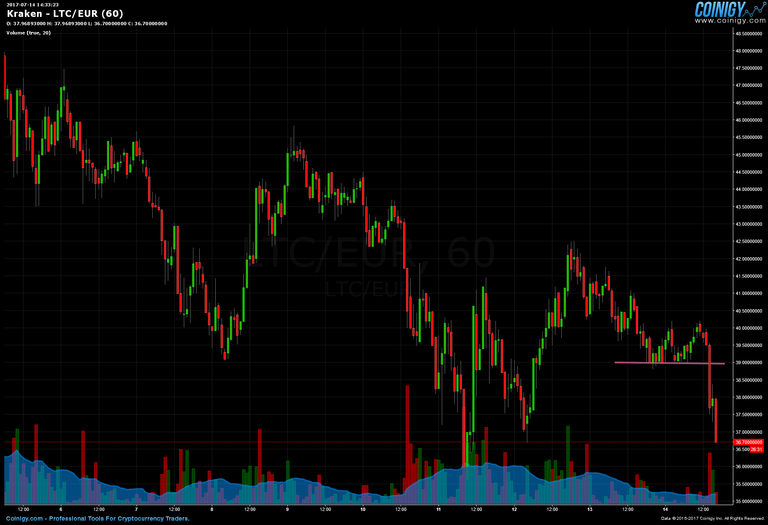
Assuming the rest of the chart looks good, going back 1-2 months. Would you say this chart is a buying chart, or are you waiting for that further base to break, which would be the second base?
that base seems to weak.. especially since its been consolidating there for a while.. Btw the rest of the chart is not nice.. you have to look at a bigger picture..
Sorry no.. you need to zoom out to see more data to decide on your bases.. a base is defined by the bounce it had off of it.. so I will draw some x x x to show you the bounces that are missing, to define your bases.. notice my arrows show you too locations that look the same and dont create a bounce.. .. now i will draw in yellow the real bases and the safe circles to buy in..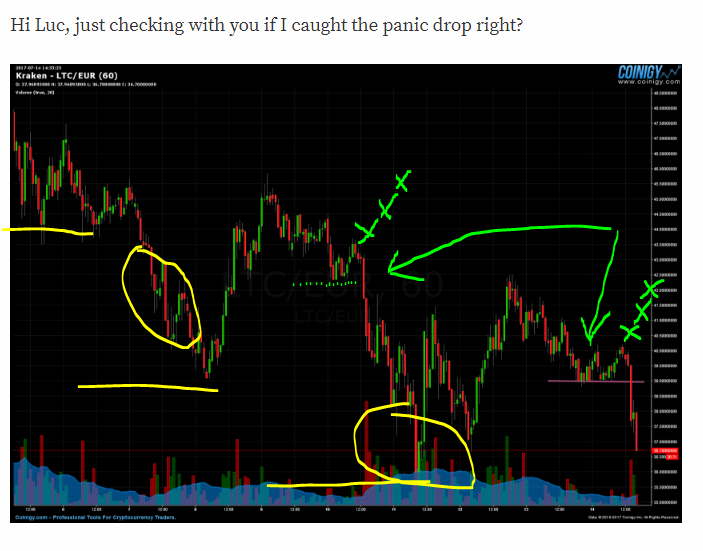
hope this helps.. pls dont forget to zoom out and look at a 1 to 2 month picture of the stock to see the bases easier..
Assuming the rest of the chart looks good, going back 1-2 months. Would you say this chart is a buying chart, or are you waiting for that further base to break, which would be the second base?
https://prnt.sc/fvqf9f
that base seems to weak.. especially since its been consolidating there for a while.. Btw the rest of the chart is not nice.. you have to look at a bigger picture..
Thank you very much ~