Conclusion for today’s EURCAD analysis: A break above 1.48066 implies bullish strength and therefore higher prices to be expected.
The 4 hour timeframe candlestick chart is presented in today’s EURCAD analysis with focus on price action from December 31, 2018 to date.
The duration mentioned above has seen the trend change from downwards to sideways, leading to the formation of a triangle chart pattern.
Instagram: https://www.instagram.com/coin_analyst/
Twitter: https://twitter.com/Cryptotrader029
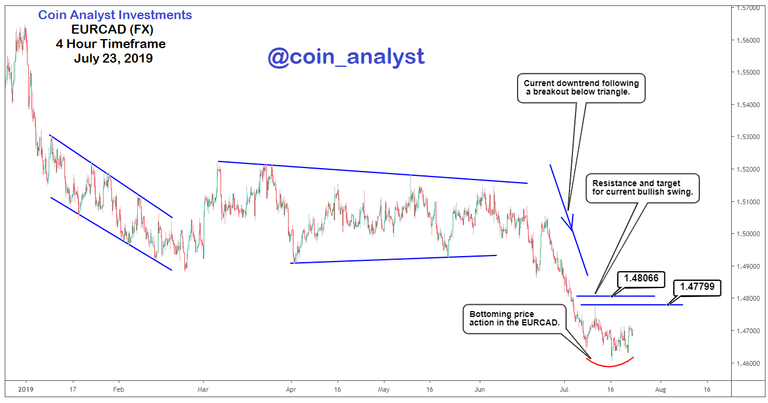
A breakout below the triangle on June 19, 2019 did confirm continuation of the previous trend and therefore resumption of bearish momentum.
July 08, July 16 and July 22 of 2019 all indicate price lows for the EURCAD that suggest bottoming of price action and therefore weakening of downtrend. It is therefore important to pay attention to 1.48066 (upper boundary of resistance) and 1.47799 (lower boundary) as any bullish reaching these price levels will be challenged.
A break above 1.48066 implies continuation of the bullish swing from the July 16 price low of ~1.46050