Conclusion for today’s USDCAD Analysis: Price closing below ~1.30762 implies continuation of current downtrend in the USDCAD.
A candlestick chart on the 6 hour timeframe of the USDCAD is presented in today’s analysis. Lack of follow through in price action above the 1.35000, and a break below the lower boundary of the long term bullish channel has resulted in increase in bearish momentum.
Instagram: https://www.instagram.com/coin_analyst/
Twitter: https://twitter.com/Cryptotrader029
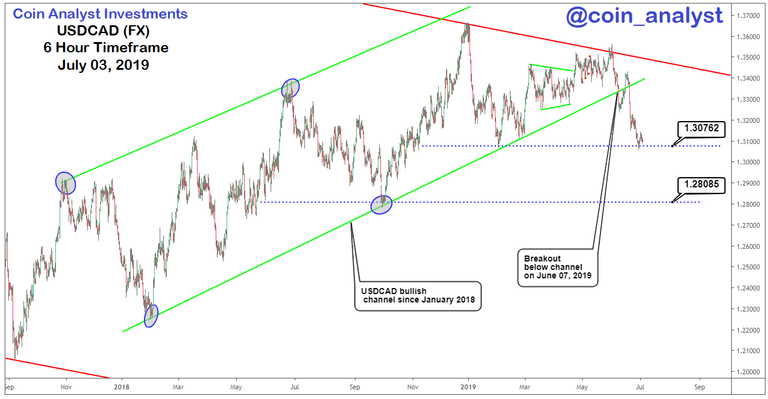
The break below channel that has lasted over 16 months implies that the current downside in the USDCAD is not yet complete and could take weeks to months.
The 1.30762 price level provides level of support that is crucial to future development of price action in the USDCAD. A close below provides a next potential target at the 1.28085 price level. A retracement of the current downtrend is therefore anticipated if there is lack of follow through to the downside.
Our previous Bitcoin analysis (BTCUSD) before the current price rally was also posted for FREE and can be found here.
https://coinanalyst.investments/2019/04/26/btc-analysis/