Today we are talking about my strategy wich i use to trade the Ger30
I am looking at two diffrent charts to get my entry and exit points. On this strategy i am using a combination of renko charting and the classic candlesticks.
Ger30 1h candle chart
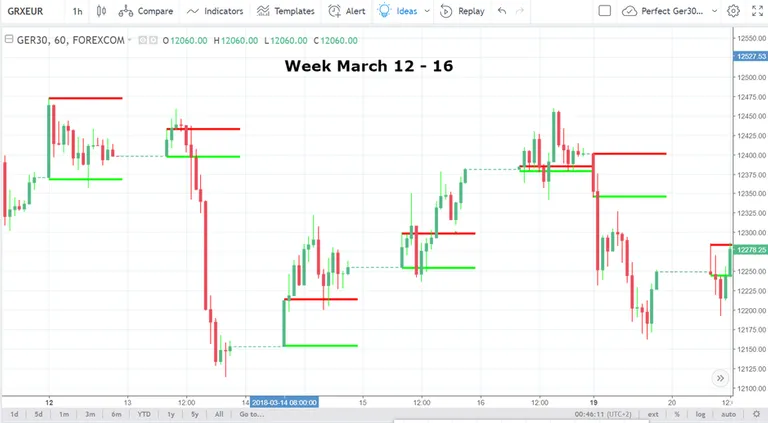
The first thing i always do is to draw the daily support and resistance level for myself. These levels are based on the first trading hour. After the 8am candle close i gonna draw the support level (green) and the resistance level (red). This is my basic wich i need to have to get my entry and exit points.
The next chart i am looking at is the renko chart

Here you can see my support (green) and resistance (red) level wich i drawd on my candle stick chart. These levels are now important for my entry and exit point. The chart i am using here is a Renko chart with a traditional brick size "10" wich means every brick equals 10 points or 0.08%.
Entry Point
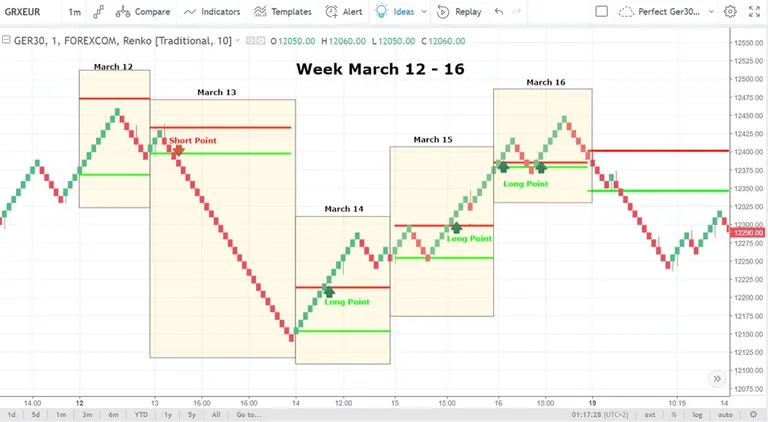
As you can see we have in the chart obove a whole week of trading coverd. We are trading on the chart the week from march 12. to 16.
So how and when do we enter the trade. As you can see i have pointed the entry`s. We are always going to enter the position if we have crossed our daily support (green) and resistance (red). But carefully a cross dosent mean we gonna entry instantly !! We are waiting for a confirmation. Our confirmation is a brick wich is fully closed outside the level. Fully closed means the whole brick is outside and dosent cross or touch the level. If this is the case we gonna enter our trade. If we are crossing the support (green) and have a confirmation brick we go for a short (sell) position and if we cross the resistance (red) we go long (buy).
There might be days without a trading signal like in this example on march 12. If this is the case we stay away for this day and enjoy a cool and hopfully sunny day off. It`s better to leave it for a day without profit if we can stay away from big trouble.
Exit Point

Here on the chart above you can see our exit points. As you can see we are always going to close a trade if we have a negative brick. Wich means if we are in a long (buy) trade and we have the first red brick closed we gonna close the trade and take the profit. Sometimes we are grinding the whole day on our trade like it was on match 13. If this is the case we always gonna close the trade at the end off the trading day wich is 21:45 (22:00 closing time). There might be some cases where we have just one red brick and then we continue going up like on march 15. But in this case we have some reEntry points wich i gonna explain just in the next chart.
reEntry Points

As i already told on the "exit point" chart there are some reEntry points. On the chart above u can see these points. We gonna reEnter a trade always if we have a green brick closed after we had a "exit point" and we are still above our resistance (red) level or below our support (green) level. If we are still above or below these levels it dosent matter if we have only one "exit point" or a "exit point" followed by some more bricks. So as you can see in the example above we had one reEntry on march 14. and one on march 15.
So what do we got that week if we talk about money ?

So now we are talking about profits and money. As you can see i have already counted the bricks we would have won each day. If you wonder why on march 14. for example are only 5 bricks counted even if you can see 6 + 1 at the evening let me explain it to you. The last two bricks you can`t count because you will exit after the "exit point" brick so you only count up to the first "exit point" and draw a horizontal then u know how much bricks u have. So lets see what we got out off these.
Form the guys who dont know how i trade i always trade with a leverage size off x100. So we already know each brick is worth 0.08%. Due the fact we trade on x100 each brick equals 8%. My investment per trade is always the same amount money ($500). And we have to take care about spreads. we will probably loose around 2-4% each trade on spreads. So lets brake it down.
- March 12 - 0bricks = 0% profit
- March 13 - 23bricks = 184% profit - 4% spread =$500 + 180% = $900
- March 14 - 5bricks = 40% profit - 4% spread = $500 + 36% = $180
- March 15 - 4bricks = 32% profit -4% spread = $500 + 28% = $140
- March 16 - 3bricks = 24% profit -4% spread = $500 +20% = $100
Total Profit = $1320
Summary
These is a pretty simpel and easy to understand trading strategy. I am not saying its the moast profitable strategy out there but i think for beginners its easy to understand and you can learn it pretty fast. Please consider that the numbers above are diffrent related on broker spreads and so on.
Let me add some personal advice and thougths.
While you are using this strategy make sure you are always using a good money management like everytime when you trade. I personaly trade on Etoro and use like i said a x100 leverage. Never use your full Bankroll on a trade and stay always straight to a strategy you choose. There might be days like March 12 with 0 trade chances. But do NOT force anything then. If you go and backtest this strategy you will see longtherm you are on the winning side.
Kind Regards
Daniel
Interesting concept what are you using to create the graphs just curious? Thanks for sharing.
Good friend publication.
Ondas de eliot, excellent post