Your videos are really nice! I wish I had seen the other ones before the deletion. A suggestion for your tonights video is talking also about how often you get to draw those base lines for each time scale and what percentages you usually expect from those dips. I'm just starting to trade (also with a small account) so I'm not always sure that I'm not missing opportunities or trying to find something in the graphs that isn't there and this info would help a lot!
PS: any tips on which low volume coin to trade?
there are soo many.. I been trading, here is one I been bouncing.. if your small, then you can trade crappy charts like this and just make 20-50% over and over.. but if you size your orders to big, you will influence the market, or get stuck in a trade where you have too much size to get out .. so you have to trade small..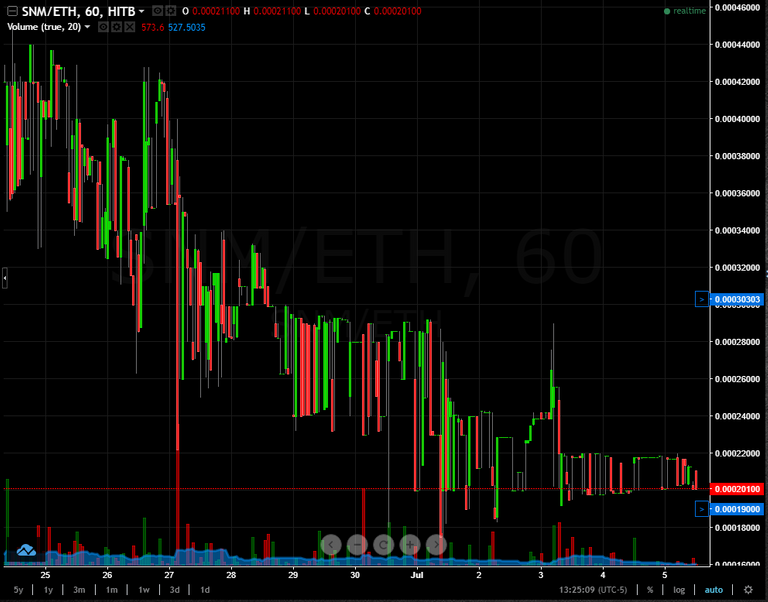
Can you recommend a good set of exchanges to sign up to? Something maybe to trade smaller, obscure instruments. And those to trade that are more liquid?
Hey Luc, Thank for your videos, your an inspiration, yesterday I made my first profitable trade with your strategy: 10% gain with EOS ;)
quick question: can you give an example of the coin volume vs the position size? for instance in a coin with 100K volume can I open $100 positions? thanks!
Congrats on your first trade.. you have to gauge your order size by the level 2 and time and sales.. you just want to blend in.. so whatever everyone else is trading regularly, thats what you want to trade also.. dont be too big .. as an example ETH has regular orders for 100 coins.. so I would make my trades from 5-80 coin orders without worrying about influencing the market at all...
This is VERY good advice, I haven't seen anyone mention this before. I was doing this instinctually without backing my thought process up with logic, your reply was worth its weight in gold to me - thnx!
I have a good understanding of how to define my base (support) for trade purchases, but I still have a tough time understanding when to sell. My selling process remains too instinctual, I would like to be able to remove all emotion and rely purely on analytics. Can you please cover this topic in an upcoming video? Should I just estimate the resistance from recent history and sell the majority at that pre-defined point while holding on to a component of the trade in the event the price continues to climb?
https://www.coinigy.com/s/i/597332559427d/
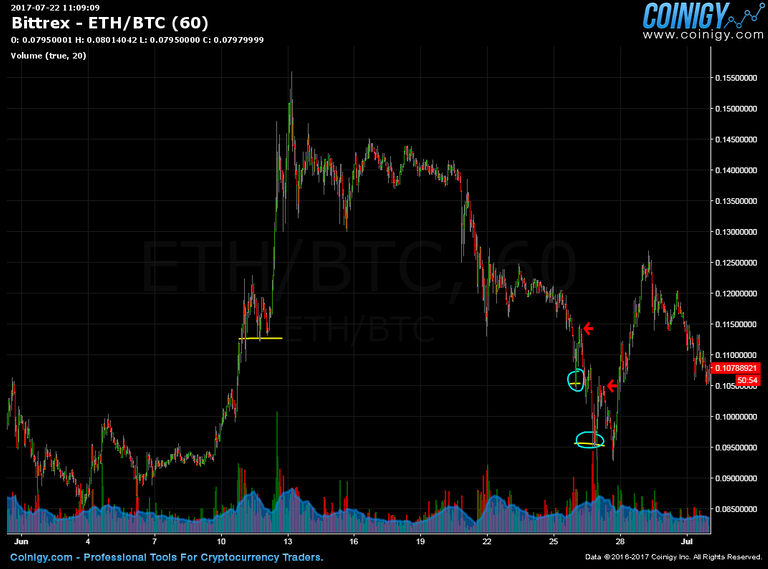
This is what I’ve got from his videos. On the left you can see the base we’re working with (June 11). That one cracked around June 26. Now if you bought around the highest blue circle it shot back up around the previous base level (the June 11 base) this is a quick 7-10% trade. You can now draw your next base (see yellow line in the highest blue circle). That one also got cracked and again if you bought around the blue circle and sold at the red arrow you again made a 7-10% quick trade.
Luc calls this participating in the market.
Now if you look at the chart you can see that if you bought more at the lower blue circle and sold when it had a major bull-run you would’ve made a lot of money. From my understanding this isn’t Luc’s method because the last base (yellow line in blue circle) didn’t got cracked so no buy opportunity.
But I’ve seen Luc still placing buy orders if he expects the price to go up. You can also sell 80% of your position if you think the price is going to be higher and sell the 20% later on.
@quickfingersluc correct me if I read it wrong.