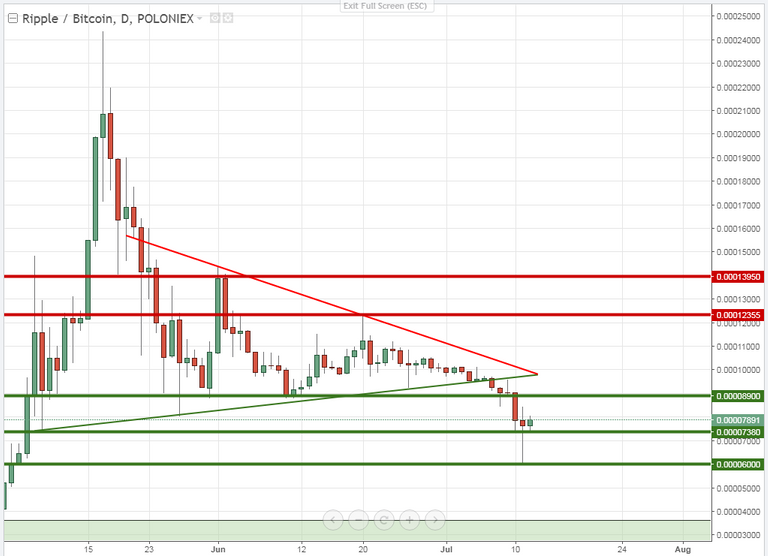
Ripple (XRP) recently got out of the symmetrical triangle and dropped more than 35%.
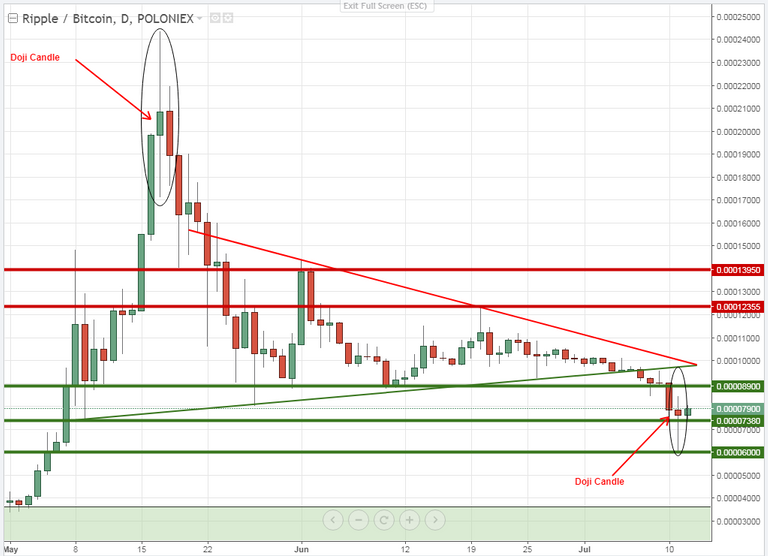
Price found a support level at 0.0000600 BTC and pushed back up by forming a doji candle.
Price had formed another doji on the 17th of May this year.
Here's how they look:
What is a doji ?
The doji is a type of candlestick and a warning sign of a pending reversal. The lack of a real body conveys a sense of indecision or tug-of-war between buyers and sellers and the balance of power may be shifting. The open and close are pretty much equal. The length of the upper and lower shadows can vary and the resulting candlestick looks like a cross, inverted cross or plus sign.
(Definition by: www.babypips.com)
The today's candle opened at the price of 0.00007650 BTC and moved down to the price of 0.00007360 BTC which price level behaves as a support and price moved back up.
If the today's candle closes above the doji which would be the price of 0.00008430 BTC, then we might get the price turnaround we waiting for.
I hope this post was helpful.
If so then please upvote and resteem to support my ideas.
Im actually glad the market pulled back. Constant mania is not good. It's a lot of profit taking but now is a good time to buy.
I'm really glad too and yes it's a really good time to buy.
Thanks for upvoting and commenting 😃
You're right! I recognised very popular formation head with shoulders. But in this case doji has bigger volume and it might be beginning of new trend (in short term). Look at my point of view - https://pl.tradingview.com/x/ieye8xCv/
Yeah that's right.
Nice chart @uzamkniete.