
this is a sophisticated trading strategy if you look at the core and in depth math, but simply applicable to any index and platform you trade.
I'll show you a Bitcoin chart on tradingview to make it simple:
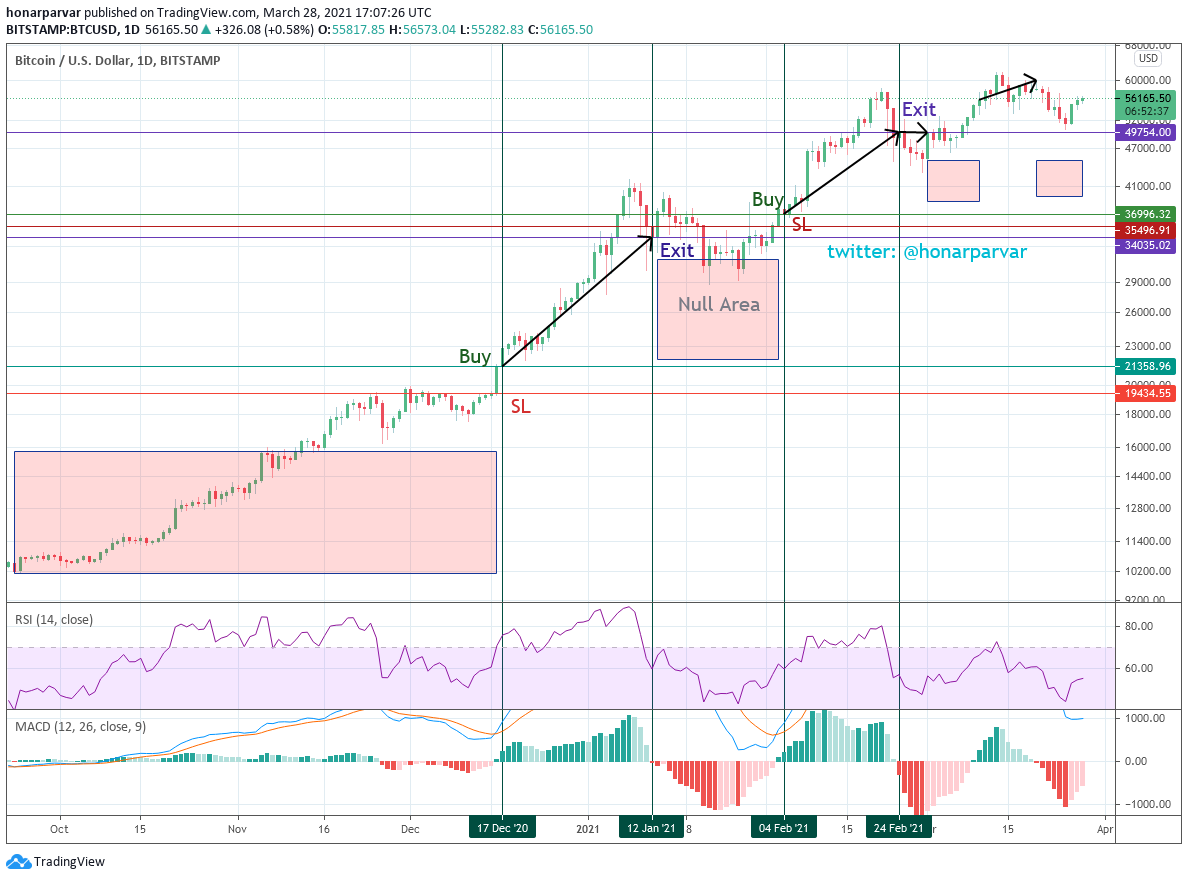
OK! find a BTCUSD chart (or anything you like) on tradingview.com, turn on the default MACD (12, 26, 9) and RSI (14)
look at the RSI, whenever it crossed above 50%,
watch MACD's histogram bars: if it crossed from below zero (red bars) to above zero (green bars) it's a buy signal.
if RSI dropped below 50% or MACD crossed back below it's an exit signal.
in the above chart, you see this strategy has generated 4 entries, one null and others profitable.
tips:
- you can change RSI to close 7 (instead of 14) for a more agile indication and maybe more signals
- you can get the exit signal from one timeframe below where you are doing the analysis for more profit per trade.
- this strategy works better in bull runs rather than bearish trends and sideways! obviously...
- you can also combine this with fibo for exits
Interesting. For all of us, non profis, when is the next dip:)))?
in the weekly chart, if the current candle closes above 55800 USD we can face a RDiv next week. so on the 12th April things may get really bad. like the 22nd Feb candle or maybe worse.
thanks for the tip :) will look closely if there will be any discounts to power up... if anything new please share in the sake of us newbies:))