So you've just picked up your first fraction of a Bitcoin and already decided that being a cryptocurrency trader is a fantastic substitute for sex, social life, video games, sports, sleep, or any other boring nonsense that you used to enjoy.
Congratulations!
You are now on your way to becoming a very successful cryptocurrency trader already. To celebrate this great milestone in your journey, I'm going to show you some sweet Bitcoin charts, because let's be honest, you've been staring at them for so many hours now that your brain is trained to release endorphins whenever someone mentions the word "candlestick".

Looks sexy, doesn't it? Look at all those wicks. Mmmm...
But wait, what's that orange line in the middle? It's so smooth and soft, and all those candles just gracefully dance around it. It's almost therapeutic to look at. It's as if every time the candles get near it, they wanna stay close to it. But why? What is this magical line? And most importantly, how can you use it to steal some more of that delicious Bitcoin from all those amateur traders unlike yourself...?
Well, today happens to be your lucky day. Because you're just about to find out!
That line is called a Moving Average, and I'm here to tell you all about it, my friend. So sit tight, grab a preferably alcoholic beverage of your choice, and enjoy.
The Simple Moving Average, which is often abbreviated as MA or SMA, is a common indicator used by traders to measure the average price of an asset over a fixed number of periods in the past.
It is really that simple.
Why is it useful, though? And more importantly, how can it help you make money?
Those are very good questions. But before I explain how you could make some sweet, sweet gains just by looking at moving averages, I want to go over some market psychology with you. You don't wanna end up like those noob traders do you? To be a ballin' trader, you need to understand the market psychology before learning how an indicator can help you assess and predict it. So let's get to it.
Let's stop thinking about Bitcoin for a second. You can do it. It's easy. Trust me. I'll wait.

Stop it. Focus.
Alright, you're with me? Cool.
Imagine you're trying to buy a brand new car (surely a Lamborghini) with all those sweet gains you made through trading. So far you've checked out 5 dealers, and all of your friends have already bought their Lamborghini, because you've abandoned all of your friends now and only hang out with traders.
The problem is that every dealer you talk to is offering you a different price, since they're all competing with each other, trying to get the most profit on their sales. Clearly you should go with the cheapest dealer, right? But the guy looks a bit sketchy, with his fake smile and the way he smells like hair products and cheap cologne.

How would you know the price he's offering to you is really, truly, and absolutely the cheapest price you can get a Lamborghini for? Maybe if you checked more dealers out, you could find a cheaper offer, but then you'd have to go all the way to the other side of town...and who has time for that when instead you could be looking at Bitcoin charts?
Maybe a better idea would be to ask all your friends who've already bought their sweet rides. So you start asking around, and realize that, on average, your friends have all bought their cars at a cheaper price than what the tacky car dealer is offering you. That jerk! He's trying to rip you off! We can't have that!
So you grab your non-Lamborghini and drive back to the dealer, demanding to see the bastard. After hours of bad jokes, fake compliments, and heavy sighs followed by "Let me talk to my manager and see what I can do..." lines, he finally agrees to sell you the car closer to the average price.
You have to remember that the reason the dealer was so reluctant to give you the car at your price is because he also had a bunch of dealer friends who recently sold cars to their own customers and he wants to make sure he squeezes as much profit as he can out of this deal. He probably also hates you.
But forget all that for a second, and appreciate this moment.
You now own your very own Lamborghini. You also bought it at a fair price like the pro trader that you are. Pat yourself on the back and congratulate yourself! You deserve it!

I wonder how it'd feel to rub your face against that shiny clear coat...
The important lesson here is that you, being the ballin' trader that you are, were patient. You put in the effort and time to figure out the best possible price you were willing to pay for you Lamborghini by looking at its average price between your friends, who are just a small subset of all the Lamborghini owners in the world. In other words, you believed that the fair value for a Lamborghini was the moving average of its price.
Well, guess what! Everybody else also thinks that. Welcome to the market! Unless you're a noob trader who just heard about Ethereum and how it's going to the moon, you're always looking to buy your coins at a "fair" price. This is what makes the moving averages so important. It tells you what most people think is the fair price of your favorite coin and it helps you figure out what is a good price to buy or sell.
Every trader has its own idea of the "fair" price depending on how long he's planning to stay in a trade, and ideally, every profitable trader aims to buy at or below the fair price, and sell at or above the fair price.
Now that you know how the moving average allows you to understand market psychology, I'm going to explain to you how I use them for technical analysis. Why? Because I want you to trade like I do so that I can predict the market more easily and steal all your Bitcoins. Because I'm such a nice person.
As I mentioned before, the goal of every trader is to buy at or below the fair price. In other words, as the price comes down closer and closer towards the moving average, there are more traders who are willing to buy the asset. This makes the moving average act as a Support. Conversely, the goal of every trader is also to sell at or above the fair price. Which means that as the price move up closer to the moving average, there will be more traders wanting to sell the asset. This makes the moving average act as a Resistance.
When the price falls through the moving average from above, this means that the sellers overwhelmed the buyers and pushed the price down. Similarly, if the price breaks out of the moving average from below, this means that the buyers overwhelmed the sellers and kicked the price up. In both cases, a lot of force and momentum is required to make this happen, which is usually indicated by high Volume.
You also have to consider that if the price falls through a moving average, it means that a lot of traders who were trying to sell above the fair price are now going to start losing profits. They might panic, and start cutting their losses, which further adds to the volume, which further pushes the price down. The opposite is also true for when the price breaks out of a moving average, because a lot of traders who were trying to buy below the fair price are now missing out, and want to get in on the ride before it's too late, which also adds to the volume, and further pumps the price up.
Some of these guys are the ones who will be paying for your Lamborghini because they traded based on emotion. It's great, isn't it?
Another point that you need to understand is that the length of a moving average is directly proportional to it's strength to act as support or resistance. In the example above, imagine instead of just asking your immediate friends for the price of their rides, you asked all of their friends too, and friends of those friends, and their mothers and brothers and sisters.
Literally every single one of those people has bought a Lamborghini already. Shame on you. Regardless, the point is that the more people you ask, you get a better idea of the true value of the Lamborghini, and so the dealer has less power to rip you off.
In summary, there are three rules you need to remember:
When the price is below the MA, it likes to stay near or below the MA.
When the price is above the MA, it likes to stay near or above the MA.
The length of the MA is directly proportional to its strength.
Here's an example that helps illustrate these points:

In the example above, the blue circles indicate areas where the moving average is attracting the price and pulling it toward itself. Red circles indicate areas where the moving average resists the price, and green areas indicate where the moving average supports the price.
Now, if you're a smart trader that I'm sure you are, you should immediately be seeing a trading strategy here.
Based on the second rule, if the price is above the moving average, then it likes to stay near or above the moving average. So what if you were to buy every time the price crossed up and over the moving average, and sell every time the price crossed down and below the moving average? Sounds pretty simple, doesn't it? Let's see how we'd perform if we did that...
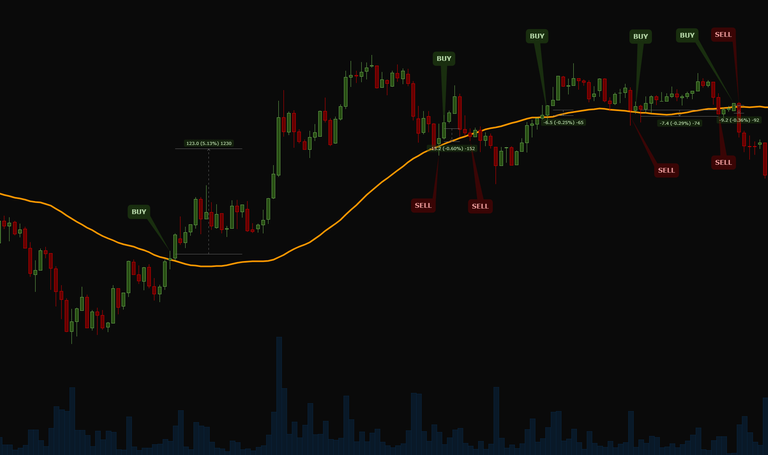
Gross.
That is just awful. Disgusting. But why...?
The problem is that the price is always in constant fluctuations, especially in the cryptocurrency market due to its volatility. Because of this, if you were to mindlessly follow this strategy, you'd probably lose more money in trade fees than you'd gain from profits.
If only there was a way you could smooth out the price and ignore the minute-to-minute price fluctuations. If only there was a way...to get the average price...during a shorter period of time...that moved...with the price...sort of like...a moving...average...!

It's magical isn't it?
This strategy is often called the MA Crossover strategy, and there is a whole bunch of fancy variations of it. You can learn more about them by clicking here.
Of course, it's still not a very effective strategy. Otherwise, I'd be probably be in my own actual Lamborghini right now, on my yacht, with stripper...on the moon; but instead here I am writing this stuff to educate you. But I'm hoping you can clearly see the benefits of using crossing moving averages as just one of the indicators in your toolbox.
Now before I wrap up this unintentionally long post, I want to end with a few quick notes:
Firsly, in this post, I mainly focused on the simple moving average. There are different variations of moving averages, such as the Exponential Moving Average, or the Double-Exponential Moving Average. The other variations tend to be more sensitive to the price movements, and can be used for more accurate measurements. However, they don't make the simple moving average obsolete, as sometimes you want the moving average to stay insensitive to price movements. I'll leave it as an exercise for you to learn about the different variations.
Secondly, I intentionally left out the length of the moving averages I used in the examples above. This is because I think the length of a moving average is a purely a matter of taste. I suggest you play around with different numbers and see what you like. Some coins tend to behaves better to some values more than others.
Personally, my favorite set up for moving averages are:

There is nothing magical about the numbers 21, 55, and 144 (other than the fact that they're Fibinacci numbers and since all traders tend to get sexually aroused when you mention the dude's name, there is some self-fulfilling prophecy aspect to these numbers). I personally chose these by testing many different combinations, and deciding that I like these the most.
I hope you found this post useful. If you did, let me know that. I'd be happy to post more of my ideas on technical analysis and trading.
If you wanna support me feel free to donate some btc : 159rYoLUjx4LJPugULj8mLVY2JnTRD8kbQ
Mister.Baart
Post on steemit! I support you! I just sent you some SBD to you in your wallet.
thank you i apreciate it :D
Great lecture... I do know quite some things about the MA already, in fact i always use the MCDA or something like that... I like the way you throw light on the MA, i now understand it better from an angle which wasnt too clear to me initially. Thanks for a very enlightening post. Please accept this gift
Hi! I am a robot. I just upvoted you! I found similar content that readers might be interested in:
https://steemit.com/trading/@zeenobit/quick-introduction-to-moving-averages
Congratulations @mister.baart! You have received a personal award!
Click on the badge to view your Board of Honor.
Congratulations @mister.baart! You received a personal award!
You can view your badges on your Steem Board and compare to others on the Steem Ranking
Vote for @Steemitboard as a witness to get one more award and increased upvotes!