Graphic Analysis of price movements is one of the most popular approaches that is very popular among traders. Similar to candlesticks patterns it doesn't require some complicated math calculatations, additional soft or programming skills. All that you need to do is to know most popular graphic patterns and learn to find them on price chart.
In the graphic analysis all figures can be divided into two classes:
- Reversal figures, that appears when main trend is going to change its direction. In other words, turn of the basic tendency is planned.
- Continuations figures, indicating that the main market trend will not change and the market will come back to it after a while.
Let's begin with popular reversal figures:
Head and Shoulders

This figure appears on the top of uptrend and looks like three consecutive peaks, the middle one is the most highest. It not only predicts reversal but get some information about how deep will be upcoming decline. As a rule, the price go down the distance equal to the height from neckline to the top of 'head' of the pattern.

This figure also can be inverted. In this case it appears at the end of downtrend. The neckline can also have some angle.

The proper time to start trading is when price breaks neckline after second shoulder. It is E point on next picture:

Double top and double bottom

This figure is similar to the "head and shoulders" but there are only 2 almost equal extremums.


Sometimes there are also can happen 'triple top' and 'triple bottom' figures, the rules are the same.
Now it is time to learn continuations figures:
Triangles
There are three kinds of triangles: symmetric, ascending and descending.
To draw a triangle on the chart you need at least 4 points: 2 points on support line and 2 points on resistance line.
It is considered, that there was a break of a triangle if the price of closing of a candle is fixed outside one of appropriating sides of a triangle (in the direction of continuing trends). Simple intersection of a side for certain will give a false signal. The breakthrough is clear if the price after intersection of triangle line returns to a broken side, and then goes in the direction of the prior trend to continue.
Example of descending triangle is on the following picture

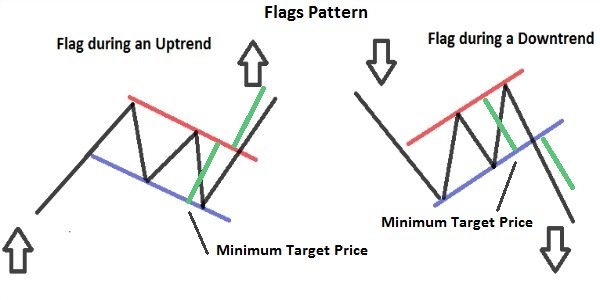
Flag
The flag figure is a minor price channel, as if "dressed" for the previous price movement.

Remember about probability. if you have doubts about some pattern, look at the chart with bigger timeframe and/or do some additional analysis.
Wish you profitable trading!

Images: 1 - 4 - 5 - 4 - 8 - 9
Awesome, exactly what i was looking for :). Thanks
As they say, one image is worth a thousand words. So, your article is worth... er... a lot and lot of words ^^ thanks for it!
Thank you for your reply :) If this post is popular I will share some other info about price chart analysis.
educational, ive benn looking on this as a newbie trader. upvoted, resteemed!
Really nice article! Im trying to trade a bit more seriously so this will surely help.
Thanks a lot for this link. its very helpful
Very happy to have come across this. do share some more insights. I am learning at the moment on how to trade effectively.