In my post yesterday, https://steemit.com/trading/@xaero1/bitcoin-ta-another-triangle-formation-and-could-this-break-soon , I presented a fairly negative sentiment scenario for bitcoin medium term, based on some charts.
Today the price did break below the triangle I had drawn. (And btw, this co-incided with Sunday morning UTC, which, from my experience seems on average to be not the best time for prices.)
However:
(1) The break down only went very slightly below the triangle
(2) It didn't go below the previous recent low point (almost a double bottom even, which is normally positive)
(3) The bounce back was quite powerful - and, in fact going above where it started.
So, all the these factors look a bit more positive, at least in the short term.
Now, often what people do when the price breaks out of a triangle, but not significantly, is to just draw a new triangle :)
This is not really scientific - although you might say the same for all of TA! Anyway, based on the new data, I've drawn a new triangle :) Only time will tell if this is any better than the last one, however. One thing is though that in hindsight, the previous triangle was pretty steep - which didn't give it much time to resolve.
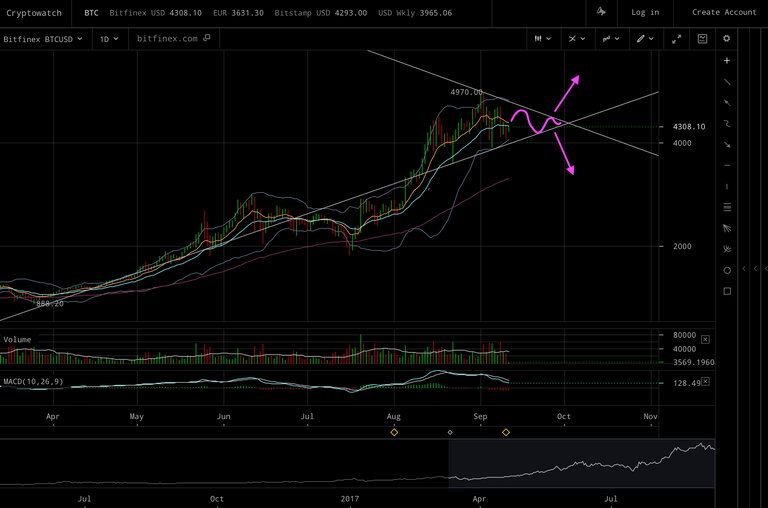
In this case I speculated about what might happen if we got the typical triangle-like pattern. We would then expect the price to break up or down at the end. (Note: This is just speculation, and not any trading advice.)
The Ethereum chart (as well as pretty much all of the other cryptos) have recently been very similar to bitcoin. I.e., the whole of the crypto market has been moving very much in sync. Anyway, here's another chart, this time showing what a triangle pattern could look like for ethereum (again, pure speculation, and not trading advice.)

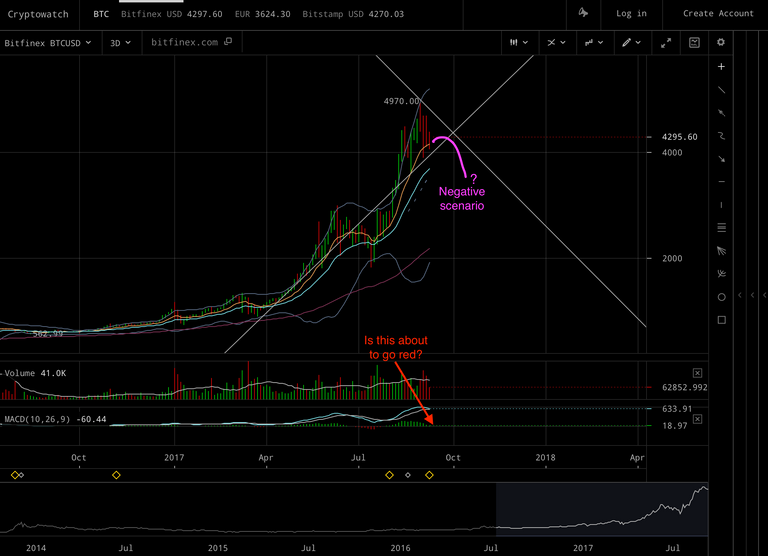
Now, an interesting thing is that if we move to the 3 day charts, the shape of the Ethereum EMA's look to me just a bit more positive than the Bitcoin EMAs. This is purely subjective, and someone else viewing the charts might take the reason view there's nothing discernible to back this up. But, for argument's sake lets just imagine Bitcoin were to break downwards, but Ethereum upwards - then we might get something like the following charts:
and
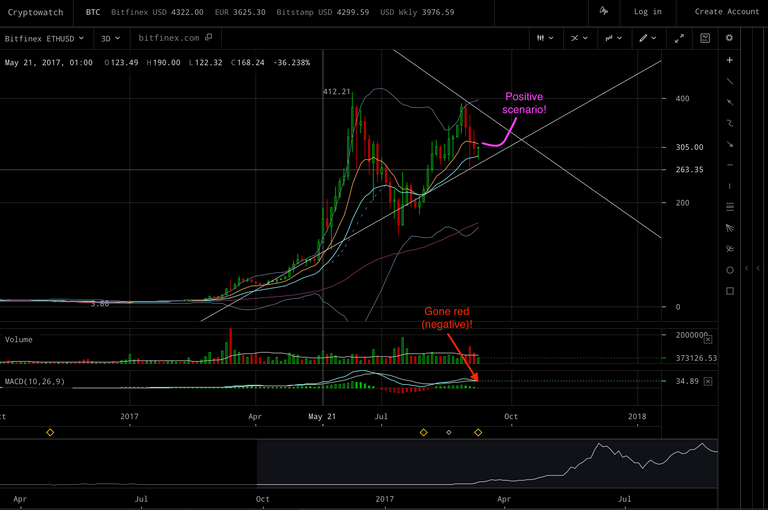
First of all, on the Ethereum chart the MACD has already gone red, so this not a positive factor. On the Bitcoin chart it's still green, although looks like it could go red soon.
I guess the main thing I see which is slightly different in the two charts is the shape of the gold EMA lines.
On the bitcoin chart, we've got a very rounded curve, which is still ascending. But when I imagine where it might go next, I'm drawn (no pun intended ;) ) to a symmetrical downward scenario following it as not an unlikely prospect.
However, on the ethereum chart, we see that the gold EMA has started to descend but it seems to be not descending as rapidly as it ascended on the way up. This is the main very slightly 'positive' thing I'm seeing.
Note that the bitcoin chart EMA hasn't started descending yet, so maybe it will do the same thing - or maybe even it will start ascending again more rapidly (which would mean the price would have been moving upwards again).
But the other reason why I'm semi-expecting that Ethereum might have a bump upwards is due to the fundamentals: part one of the Metropolis hard fork is due to be released within around a month or so's time. As well as adding some functionality, a key thing is that it decreases the supply rate by 60%, from what was occurring around six months ago before the 'ice age' started increasing block times. It's possible that because the issuance levels may be quite similar to the levels that the ice-age has now reached, we shouldn't expect much impact on price. Or it could be that the change has already been priced in with the recent rise.
However, it's still close to a very significant reduction in issuance from the around the last peak when we hit over $400. And many people suggested that the recent 'halvenings' in bitcoin and litecoin would have already been 'priced in' - but the reality was the prices roughly doubled in the weeks before the halvenings!
However, if we look at the Ethereum price relative to Bitcoin, it has slowly been falling over the last few months. So, for Ethereum to go up, but not Bitcoin, there would have to be a big spike in the following graph in the next few weeks:
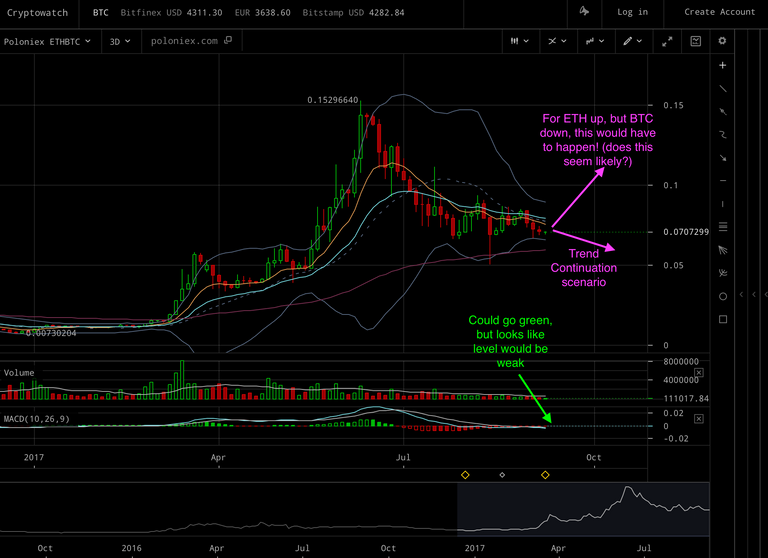
If this doesn't happen - and currently it doesn't look too likely to me from the charts - then clearly this particular outcome where Bitcoins goes down, but Ethereum goes up would not take place.
Update: As I was typing this post up earlier today, I wasn't watching the chart, and bitcoin 'crashed' over $200 and I was in a 'buy' position and so missed selling before this (which cost me! :'-( ) So as I was pretty annoyed, and closed my computer down and didn't post this! Anyway, as I made the charts I thought I might as well post them, and give an update since :)
Right now, as I'm typing it looks like we might just be forming short term local bottoms on the Bitcoin, Ethereum, and other crypto charts.
The charts are very similar, but here's the current Ethereum 6 hour chart
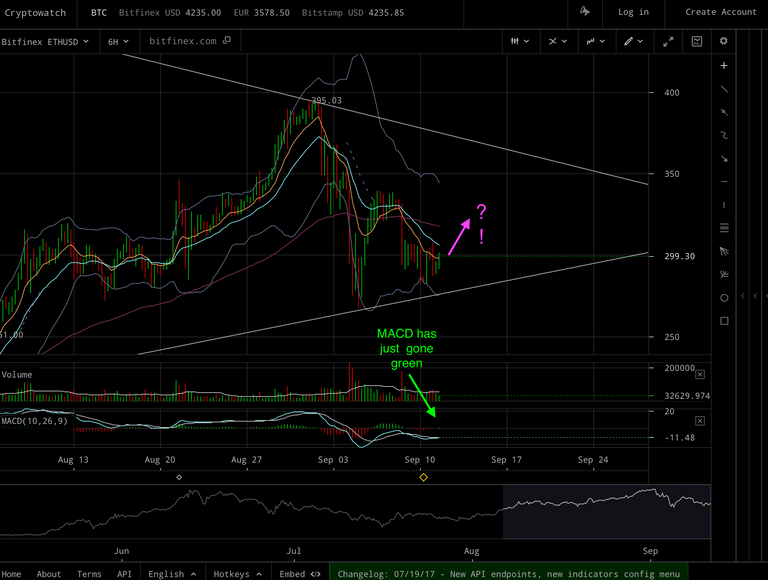
As we can see the MACD has just gone green, which is positive. But will see the price move up?
Here's the Bitcoin 2 hour chart:
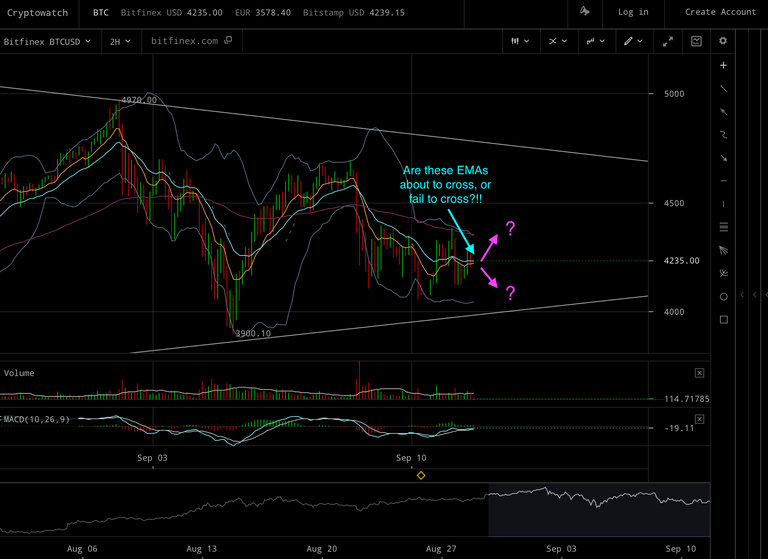
If the EMAs cross over to the positive direction, then I would expect a short-term upwards price movement could occur.
There is one thing I notice about the current bitcoin 'top'. It looks to me like it's slightly asymmetrical in a positive way. Do you see this at all in the following graph, or maybe I'm imagining it? Often at the final end to a dramatic price move we should expect the downward part to look very similar to the upward part, or typically with crypto, a much a steeper decent. And, we haven't had a 50% retrace yet which I find unusual.
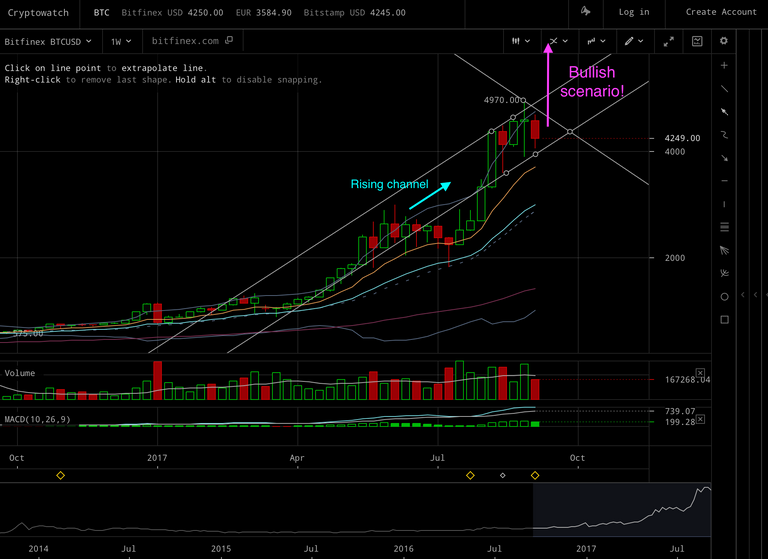
So here's a bullish scenario for bitcoin :)
But, I still think that a 'correction' is what's much more likely to happen next. But either way, I'll be following charts, and trying to reacting accordingly.
Finally, here's an interesting chart from 'coin.dance' which shows the market caps of bitcoin and the other cryptos.
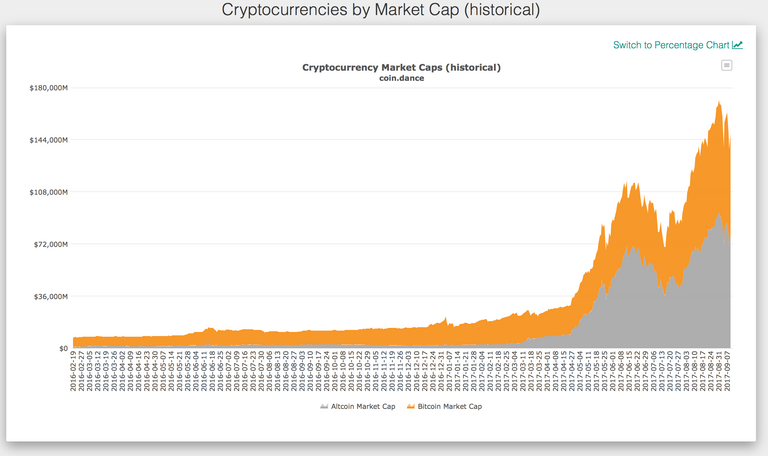
Does this look like we recently formed 'a top' - and if we have indeed formed a top - then, does this suggest a period of correction is next (or even the end of the whole 'bubble' :( )? Guess we will find out in the not to distant future!
I'd be interested to hear if anyone thought this post was interesting, or if anyone has views on the where they think Bitcoin / Ethereum prices are heading next?
Disclaimer: The post is not offering trading advice. And all of drawings presented here are just speculation about some potential scenarios (out of the infinitely possible scenarios for what might happen!) - and are not necessarily my expectations even, either.

Wait... wow, I posted this?😂
Lol. It's fascinating to look at this stuff in hindsight.
That is nice descriptions. Over the past 24 hours, the value of the largest crypto-currencies - bitcoin and ether - has changed by less than 2%. For many of us, this is bad news, but in the long run, low volatility can act as a catalyst for positive changes in the crypto currency market.
how do we get the upvote as long as jagan 0.37, i pengin upvote like your post ...? please explain @xaero1
Bitcoin will reach $12,000 by March 2018.
Come back and read this post and then comment to me and tell me that I was right :-)
NOT BAD at all
HAHA I'm going to bookmark this!!
Hai @xaero1
What do you mean ??
On the bitcoin chart, we've got a very rounded curve, which is still ascending. But when I imagine where it might go next, I'm drawn (no pun intended ;) ) to a symmetrical downward scenario following it as not an unlikely prospect.
Follow @mukliss
I am thrilled to see you so great ,, you are also a generous and amazing, because you I see can help people @xaero1 ,, I also ask for help to you to help me ,, I beg you to vote and follow me @danker
I hope you are in good health and do not achieve losses ,, I am sad if you have problems because I believe you are a good person, I will pray to God to protect you
@
all have a big effect on bitcoin, if bitcoin drops the price then steam is also like that, hope for all member to buy steam or exchange sbd with steem because steem price equal to sbd, 😎
@xaer
if anything like this then everyone cries and will party if there is a miracle

@
@xaero where now why not visible in my post, please come @muhammadridha
Good to see you back doing some TA man... I must admit, in the past couple of months I've been not looking at charts too much so I feel a bit out of the loop. It all moves so fast and confoundingly too. Lol. I feel like I'm a little more educated hearing your perspective and I'm looking forward to seeing what happens into the winter. Thanks @xaero1 have a good one!
P.S. I don't normally do this but I shouted you out in my meme / satire poem called I'm Still Not Rich From Steemit... Hope you don't mind! You were one of the first bigger users on the site that took the time to respond, and I always dug your memes and crypto knowledge. Sorry that you get spammed so much now, lol. I appreciate you stickin' around the platform cause Steemit can always use genuinely nice/humble people. Anywhoo, peace out!
P.S. not expecting an upvote btw, just want you to see it :D
Great post, very useful information! Thank You!
I've read it all but is seems here are more questions than answers (well i know nobody can tel for sure). The only thing that i find really amusing that when i used to trade before, currencies would differ, some go up and some go down and you could play them.
With the recent developments, which is new to me, i find it interesting when all the prices, for all the main currencies drop almost identical percentage, and when they start to climb up a bit they all do at the same time and almost for identical values.
Looks like you are a man to ask: "What might be the cause for such a synchronized movement?" As nothing else does not prove working, neither triangles, nor Fibonacci have any sense and currencies just act weird and chaotic.
This is only true for the big ones, right? BTC, ETH, maybe LTC?
From what I understand, the altcoins tend to move in opposite directions as the largest coins - as such, steem tends to do well when BTC is depressed, etc... is that wrong?
BTC, ETH, LTC, XMR, ZEC, DASH, XRP, all the popular ones... yes, but they used to have independent up/down movement, sometimes correlated but still individual. What has happened with the last drop, they all went down together, in a matter of minutes if not seconds. And they continue to move the same in sync no matter up or down. Looks like orchestrated by some huge player.
And STEEM yes, as far as my little experience tells me, it's like some little safe haven for the money to go to, as it has huge market cap and the price is not that volatile when compared to the others when bitcoin goes down. I might be wrong, i am not an expert. But was just wondering, did not see that synced movement in the historical data...
Gotcha, thank you for explaining all that. The big picture of the cryptocurrency market is way above my head, as I only have a few thousand dollars in the game... I need to rely on people like you for the info.
No, DO NOT rely on me :) Rely on @xaero1 if you need to rely on somebody, but the best thing is to rely on yourself lol I am exactly same level as you are, that's why i was asking that question, that maybe he has some kind of explanation to it :)
Great analysis as usual. My view is ETH is bearish till it can break the double top around 400.
all just a matter of time, often in these few days a lot of coin down, but I am sure the next two days we will be partying

@xaero1
yes, i also observe Ethereum chart is best then others
@xaero1 You may be a proud person, if not your friend you will not want to upvote.
Well we went from around $2700 to $5000 in a matter of a couple weeks? The market has been due for a pullback to get back to a healthy point and this could just be the accumulation period.
WOW nice appreciation but the rumors falses are doing to fall the bitcoin JP morgan says that bitcoin is a fraud and another as John McAfee say the bitcoin is not a bubble here. This interview is taked of RT Russian
@xaero1 please upvote my post @yulie
!originalworks
The @OriginalWorks bot has determined this post by @xaero1 to be original material and upvoted it!
To call @OriginalWorks, simply reply to any post with @originalworks or !originalworks in your message!
To nominate this post for the daily RESTEEM contest, upvote this comment! The user with the most upvotes on their @OriginalWorks comment will win!
For more information, Click Here!
I was thinking that by virtue of Metropolis pt.1 ETH would have a significant jump in value.
you are amazing. congratulations yes bro
Thanks for this. Do you have resources you can point to for TA beginners?
@xaero1 pleace mypost @fadlie,,,,, pleassseee
@xaero1 I have not even though you upvote, what because I'm not your friend, what is your friend who you upvote
Nice analysis and useful information. I will trade in small quantities.
great,,,,
in two days you make a great post ,,,
very great, @xaero1
I like it
Nice share @xaero1
Can i make design for you?
great guy ,,,
indeed you are a great person, in business. @xaero1
interesting read. I personally expect a longer correction as well (without doing fancy TA)... we will see. Long run: positive!
thanks for the info!
hopefully what you want is achieved ..... @xaero1
Ohh got a new avatar,cool. Will Chinese government banning all crypto exchange have negative impact on Bitcoin? As you are bullish on Bitcoin will it touch 5K ?
this is just a great guy post ,,,
very impressive,,,
Interesting explication about the price of bitcoin, is a very practical, simple and at the same time everything we can understand in regards to the nature of bitcoin, it is very important to always have good information that clarifies many doubts about it thanks for sharing friend
Regarding BTC.. I agree fully with you .. You are right with bullish scenario
But correction is active on the short term..
Bitcoin price may move toward 3793.00..
i am hoping for a bubble burst, need to convert more fiat to crypto
Nice post @xaero1. greetings from me @xaero1
Dang sorry to hear you missed buying when writing this! At least ya didn't fall asleep this time. For da people! ❤ hehe well. I'm sure you will
Catch the next buy session and then be well on your way to visit the beach! 🙃
Upvoted by @mariaozawa , upvoted community helps minnow steemit . explanation HERE !!!
really like your analysis. resteem.
two days ago i have a special poem for you ,,
but you did not come ,,,
I am waiting for you.. @xaero1
you also never come again in my chat ,,,,
Now a bit of growth we can sense in the price chart but Eth is not looking great for long term quite cheeky with prices i guess
I just want to ask you for help as many honorable popes, I created a UPVOTED COMMUNITY program, but as you can see in my post when promoting upvoted community, not having seen my post, I want to ask you to look at it even for a while my post HERE !!!
my program wants to help the minnows in steemit but see i do not have enough steem power, i just a minnow too, i have to give them 100% reward every post but my post limit is so fast so i can not upvote many post minnow other. at least I just want you to catch a glimpse of my post so minnow just as I can grow. I am very grateful to the pope like you @xaero1
you have forgotten me look at my new post @xaero1
(@#*&oddbot VERY like @xaero1 teknikal analysis...*&@#^