January 2011 was an inverse hammer. An inverse hammer documents characteristic action during an interval of time. The beginning of the interval is called the open. The end of the interval is called the close. An inverse hammer denotes a low open, a rally, a decline, and a low close. A rally followed by a decline creates a top. The inverse hammer documents a top. The inverse hammer low open is low relative to that top. The inverse hammer low close is low relative to that top.
The inverse hammer top is set up by a rally, but it is not a top until it is followed by a decline. The inverse hammer is not an inverse hammer until after the close. After the close we know the range of the candle. If the open and the close are both near the bottom of the range the candle is an inverse hammer.
The January 2011 inverse hammer poked above a recent top. Define poking.
After making its top an inverse hammer returns price to a "low" level. This is why it represents a buying opportunity, and a "buy signal." Define low. Define opportunity. Define signal. Low is low relative to something else. A buying opportunity is a low price. A signal should be assessed before it is acted on. Define "assess."
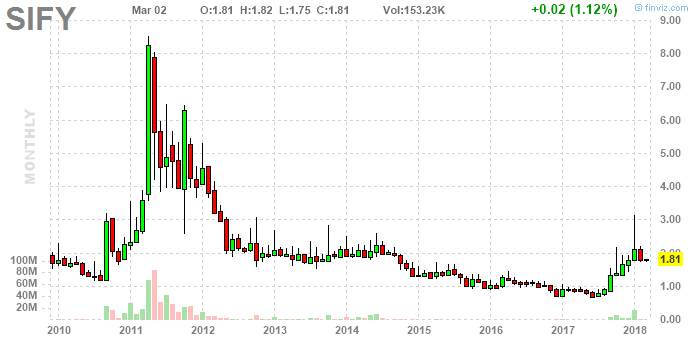
April 2011 was a big green candle, or, if you like, a giant green candle. Remember, it was not a giant green candle until the close. Before the close it was only potentially a giant green candle. Also note that something is giant relative to some other thing or things. A rule is selling after big green candles. It is not a completely reliable rule, but it could nevertheless be called reliable. Define after.
What I am trying to figure out is how to trade and also how to teach trading. The word trading denotes a kind of activity that is designed to make the trader money at an accelerated pace. A pace is accelerated relative to some other pace. Trading is designed to make a trader money at an accelerated pace relative to another kind of activity, buying and holding.
In order to discuss a pattern we need to be able to characterize it. The January 2011 inverse hammer can be characterized as being, first, an inverse hammer, and then an inverse hammer that poked above an earlier top, and also one that "followed" a big green bar. All characterizations are partial. Additional characterizations could be proposed. At any rate, we could look for patterns with these characteristics: it was an inverse hammer that poked above an earlier top and followed a big green bar. We would then know that in this example of a pattern with those characteristics a giant green bar followed.
A pattern also needs to be characterized, as demonstrated, by the action that followed. This is characterizing the following action. In this case after the inverse hammer the price went up and it did not first go down. On a note of caution examples can be found of inverse hammer following action characterizable otherwise: the price went down before it went up, and the price went down and it did not go up.
Traders are famous for using stops. This is why I cannot, at present, call myself a trader. We could, however, hypothesize: at the end of a month, look for monthly inverse hammers, actively trade, and poking above etc. etc. At the beginning of the next month, buy them. Then, if the price goes down, sell them. If the price does not go down, sell them after a big or giant green bar.
Thank you. Copyright 2018 by @xnpbgsw, all rights reserved. No portion of this material may be reproduced without written consent of the author. My recent posts are Space news and Naked trading.