Infographics can be a really powerful addition to your posts and can even be used in videos. What exactly is an infographic? It’s a visual representation of information which makes sometimes complex data easily understandable at a first glance.
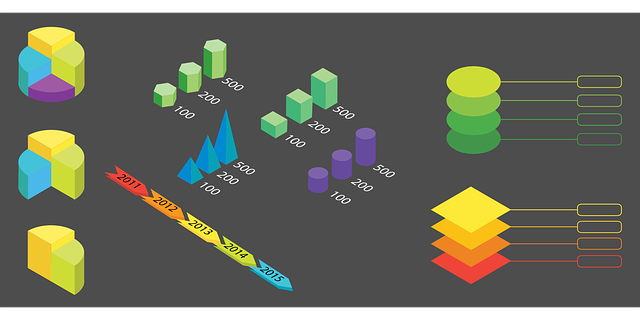
Courtesy of Pixabay
Infographics are the old “a picture is worth 1000 words” idea at work. Because we have so many readers from all over the world, infographics are very useful in our posts, helping people understand what we are writing about using images and graphs that are “word light”. Instead of wading through 1000 words of explanation, a visitor or reader can get the gist of what we’re presenting with one well done infographic.
Infographics can present concepts as well as data. When you think about it the early cave drawings of a hunt were an infographic. Infographics can take many forms, timelines, graphs, icons, even pictures can be used to convey the data or thoughts and ideas. Many infographics mix different elements within the same infographic.
Here are some examples:
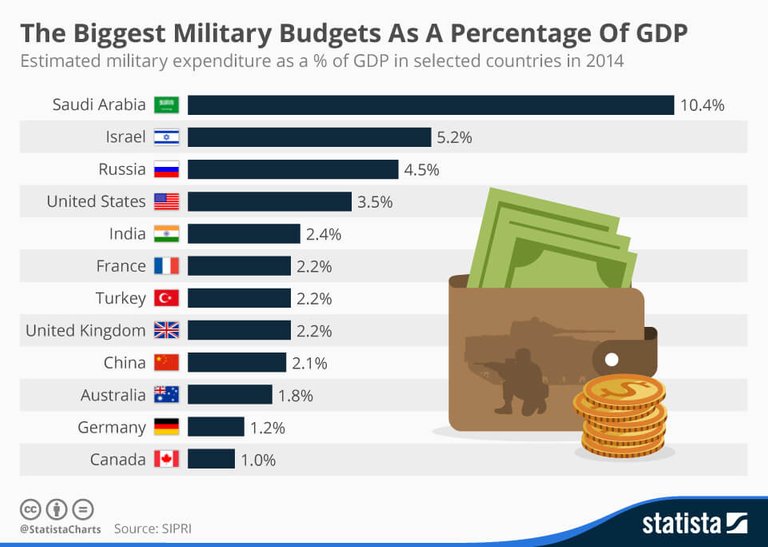
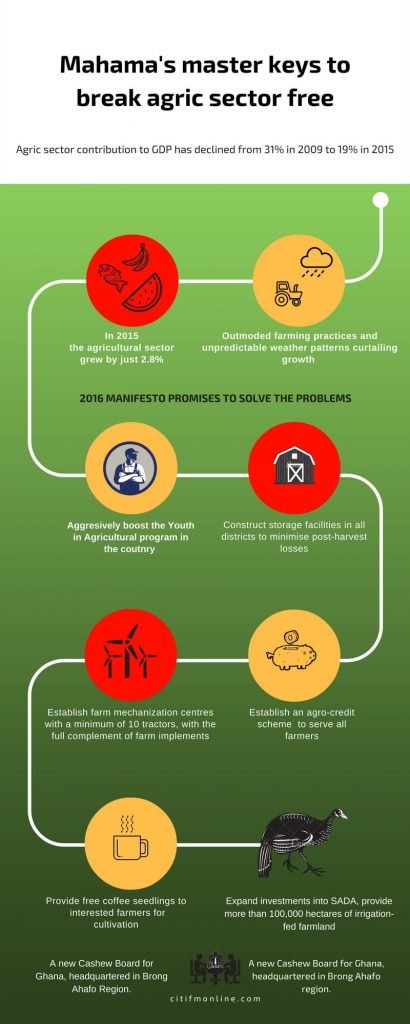
A chart infographic
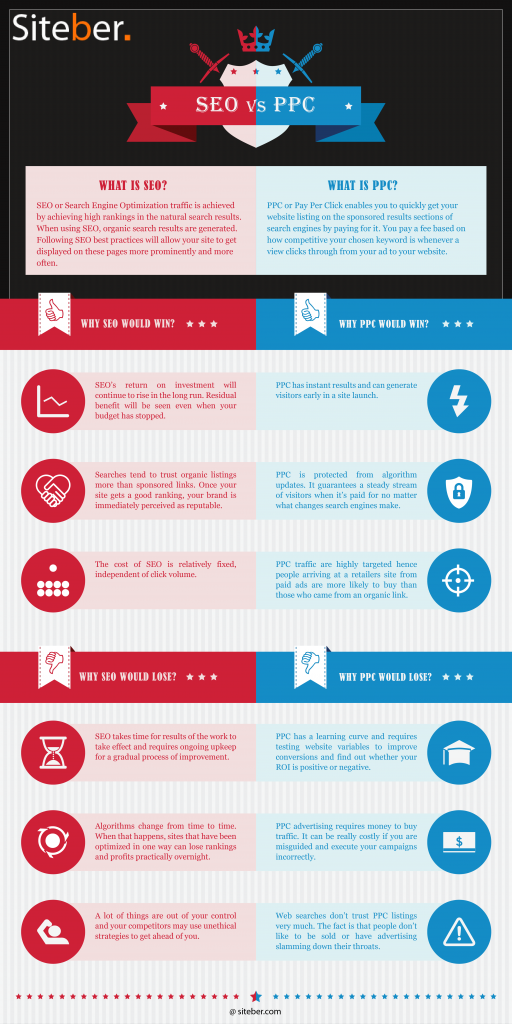
Comparison infographic

How To Infographic
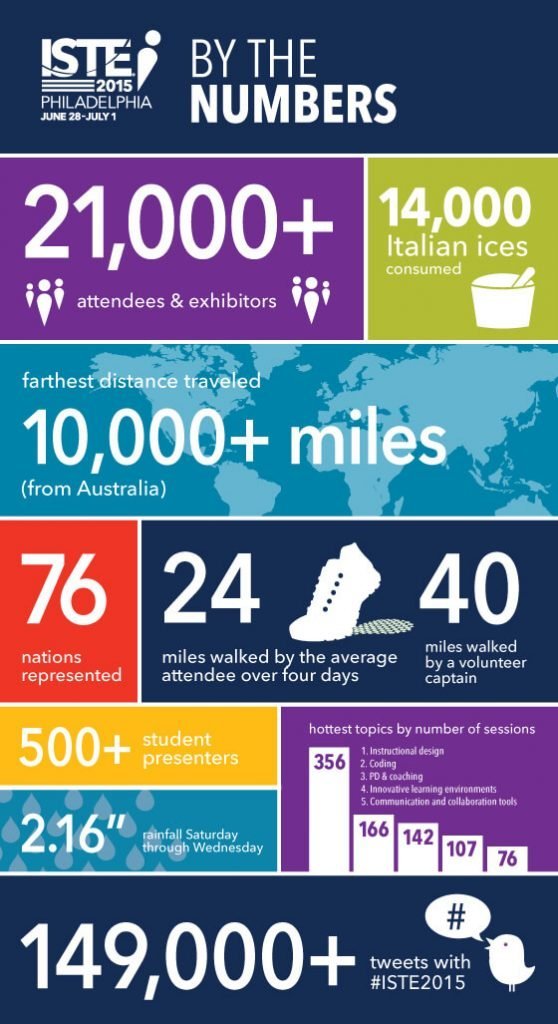
Numbers Infographic
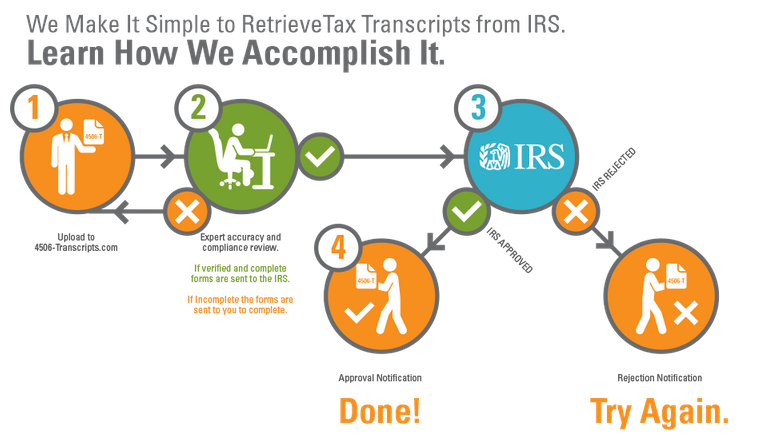
Process Infographic
Timeline Infographic
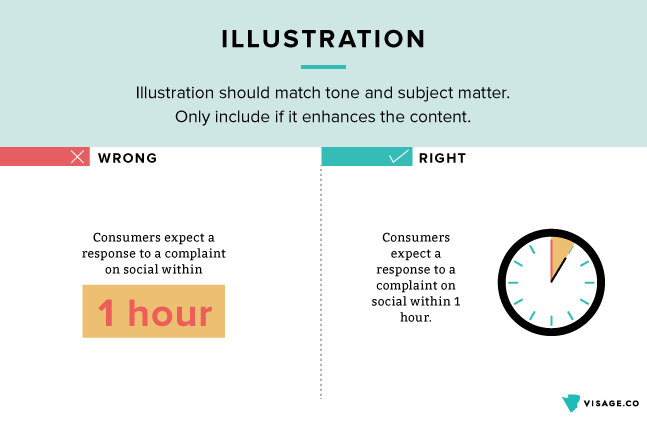
Infographic Colors
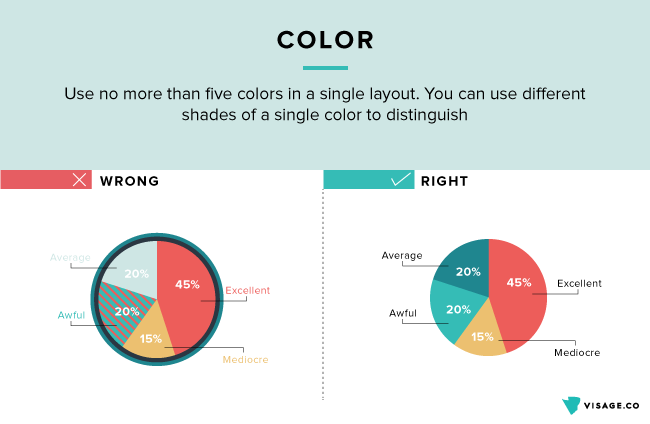
When you’re setting up your infographic, take text color into consideration when choosing your basic infographic colors. White text on a yellow background is a hard read. Choose colors that contrast well with the background color of the infographic. Also, watch the background color of the page where the infographic will be placed. While there is nothing inherently wrong with placing an infographic with a white background on a page with a white background, it can make it harder for readers to see where the infographic begins and ends.
If the infographic touches on a brand, use the official brand colors as much as possible for consistency. In other words, try to work in the client colors whenever it makes sense to do so. Some colors evoke certain emotions and there is no harm in taking advantage of their existing connotation. Blue and red show stability and trust. That’s why the bulk of financial services brands use these colors. Green goes well with environmental issues or evokes a sense of friendliness and warmth.
Finally, keep things consistent. This not only applies to colors but other elements as well. If you used a certain color scheme at the beginning of a series of infographics, you may want to stick to it in subsequent infographics on the same topic. That would make it easier for a reader to follow the story over time. Consistency applies within the infographic too. Don’t show an infographic element in one color at the start only to shift to a different color further down within the same graphic.
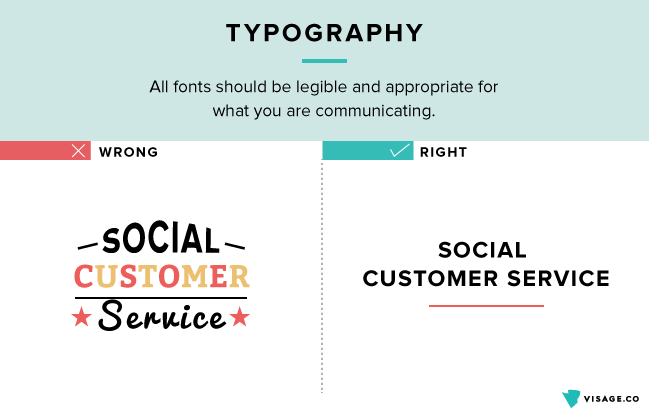
Infographic Fonts
The number of fonts has increased dramatically in recent years. There are now far more infographic fonts options than the usual Times New Roman, Arial, Calibri and Comic Sans. Fonts can be classified in several ways but many experts place them in four broad groupings: Serif, Sans-Serif, Script, and Decorative.
Serif fonts like Times New Roman have small lines attached at the end of each letter and are considered more formal. Sans-Serif literally means ‘without serif’ and these fonts like Arial, Helvetica, Lato Calibri, and Roboto do not have the small lines. They are more streamlined and modern looking than Serif fonts. Script fonts have a handwriting feel and are seen as fun, casual or elegant. Decorative fonts have a novelty to them (e.g. the snowcapped fonts on Christmas graphics) and should be used sparingly and for specific subjects.
Just like colors, not all font types will work with your infographic. As a general rule, the infographic fonts you should use depend on the infographic’s overall theme. Comic Sans, for example, will not be ideal for the majority of business infographics. The infographic fonts you choose will give readers a first impression of the content. Your font could be saying “tropical vacation” when it should be saying “Cryptocurrency Trading Platform”.
If you’re working with a brand or client that has a designated font, try to use that font whenever it makes sense to do so.
The type of font is not the only decision you’ll make on fonts. You’ll also want to choose whether to go with light, bold or italic versions of the font. Bold fonts are great for headlines and sections of the infographic you would want to draw the most attention to. Headers and sub-headers should have a larger font than the rest of the infographic.
Remember that the inclusion of text in your infographic means you are communicating an important message. The readability of the font is, therefore, a vital quality. Pay attention to how the text will be seen in different settings. Something that’s visible on a laptop may be difficult to decipher on a smartphone.
Infographic Icons
Choosing the right infographic icons can make your infographic engaging and impactful instead of boring and blah. Icons are sometimes taken for granted but can actually come in handy when you’re trying to pack a lot of information in small spaces. A single icon can replace a paragraph of explanations.
There are a number of helpful tips that come in handy when choosing the infographic icons to use. Look for items that can be replaced with an icon. Is your infographic about different types of fruits? Replace each fruit name with its respective icon. Want to show a certain type of activity such as running or walking? There are icons for that too.
Use icons instead of legends to label a pie chart or the columns of a bar chart. For example, if you are comparing the attributes of different social media platforms, you can use the icon of each network instead.
You can find icons for use with infographics at many of the free image or free vector image sites online. They often come packed as a set rather than as individual files and frequently are packaged in a specific category such as computers, or finance, or business. You can also find icons in presentation slide packs for PowerPoint, Keynote, or Google Slides.
Infographic Images
Some of the basic rules around the use of icons apply to infographic images too. Images shouldn’t ‘take over’ the infographic or else you risk reducing the graphic into a patchwork of images with a little bit of text scattered around. Images can replace what would otherwise have been acres of explanations. Make sure the colors on the image are consistent with the infographic’s color theme.
You can add emphasis to images and text by using shadows or some other text or image effect in your image editor.
You can create your infographics using your favorite image editor, but an often overlooked type of program is presentation software. Programs like PowerPoint, Keynote, and Google Slides can make creating stunning infographics fast and easy. Just add the elements, images and text you need, toss in some special effects to dress things up and then save that individual slide as a jpg or png.
There are also MANY template sites that have infographic templates available for download or for online editing, some of which are free. Here are just three of those online sites that can help you make great infographics:
Canva
https://www.canva.com/en_in/create/infographics/
Venngage
https://venngage.com/
Easelly
https://www.easel.ly/
Next up we'll take a quick look at creating the all important meme.
Be sure to check out the previous posts in this Image Series
Intro to Images and Image Editing
https://steemit.com/tutorial/@kay-leclerc/an-image-is-worth-much-more-than-1000-words
Cutting Images Down to Size
https://steemit.com/tutorial/@kay-leclerc/cutting-images-down-to-size