What Will I Learn?
- Integrate the library using gradle
- Create the chart data entries
- Attach the data entries to chart
- Invalidate and understand the chart implementation
- Invalidate and understand the chart implementation
Requirements
- Android Studio
- Gradle dependencies
- Understanding of Java programming language
Difficulty
- Basic
Tutorial Contents
Chart is a sheet of information in the form of a table, graph, or diagram. Chart can help us to analyze the statistics like how many products sold, the trading stocks price, users behavior, etc. I will teach you how to implement the candle stick chart. Candle stick chart is a chart that mostly trading stocks and cryptocurrency usedd. We can also use this library to know statistically about our products revenue, traffic and so on.
Add to project using gradle dependency
Let's get started. Create your project if you haven't, then go to the project level build.gradle. See this image below.
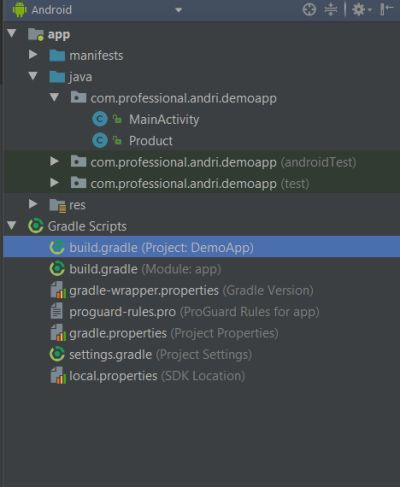
Notice the highlighted build.gradle. Choose the file and add this line maven { url "https://jitpack.io" } to repositories section inside buildscript section. Don't forget to add to repositories section inside allprojects section too. Your project level build.gradle should lookss like this.

Then, go to the build.gradle of the module:app level. See the highlighted build.gradle on image below.

Add this line to dependencies section.
implementation 'com.github.PhilJay:MPAndroidChart:v3.0.3'

Then, go to the build.gradle of the module:app level. See the highlighted build.gradle on image below.
Add this line to dependencies section.
implementation 'com.github.PhilJay:MPAndroidChart:v3.0.3'
Click sync to get the library work. Next, we are going to create the layout first.
Creating the layout
We will create the CandleStickChart using layout. You can also create it programmatically. Go to your activity_main.xml file. In this context, i am using contraint layout as its parent. Write down these codes.
<?xml version="1.0" encoding="utf-8"?>
<android.support.constraint.ConstraintLayout xmlns:android="http://schemas.android.com/apk/res/android"
    xmlns:app="http://schemas.android.com/apk/res-auto"
    xmlns:tools="http://schemas.android.com/tools"
    android:layout_width="match_parent"
    android:layout_height="match_parent"
    tools:context="com.professional.andri.demoapp.MainActivity">

    <com.github.mikephil.charting.charts.CandleStickChart
        android:id="@+id/candle_stick_chart"
        android:layout_width="match_parent"
        android:layout_height="match_parent"
        app:layout_constraintBottom_toBottomOf="parent"
        app:layout_constraintBottom_toTopOf="parent"
        app:layout_constraintLeft_toLeftOf="parent"
        app:layout_constraintRight_toRightOf="parent"/>

</android.support.constraint.ConstraintLayout>
After done you should see preview like this.

It says no chart data available because we haven't set data to the chart yet. Okay, Let's continue to the java class file.
Set data entries to chart
To be able to tell what needs to be described, we need to give data entries to the chart. First, we are creating the entries that is ArrayList of Entry Object. Entry object is in MPAndroidChart library that we need to set to the chart so we can see the statistics. Then, we set up the datas value which consist of value of x axis, high, low, open and close. We use for loop and create random float valuess. After that, we add to the entries arraylist. Write down this code.
for (int i = 0; i < marketSize; i++) {
            float mul = marketSize + 10;
            float val = (float) (Math.random() * 100) + mul;

            float high = (float) (Math.random() * 15) + 8f;
            float low = (float) (Math.random() * 15) + 8f;

            float open = (float) (Math.random() * 6) + 1f;
            float close = (float) (Math.random() * 6) + 1f;

            boolean odd = i % 2 != 0;
            entries.add(new CandleEntry(i+1, val + high,
                    val - low,
                    !odd ? val + open : val - open,
                    odd ? val - close: val + close
                    ));
        }
Notice that i create random value to val, high, low, open and close. I also add some integer there. You may also create your own arraylist and the loop inside there. Now, look at this line.
new CandleEntry(i+1, val + high,
                    val - low,
                    !odd ? val + open : val - open,
                    odd ? val - close: val + close
                    )
The new CandleEntry constructor consists of 5 parameters above. First argument is the value on the x axis that is
i + 1. Second argument is the (shadow) high value which is val + high. Third argument is the (shadow) low value which is val - low. The fourth argument is the open value which we first check if it is not odd then we use val + openvalue, otherwise we use val - open value. And the last parameter is the close value which we check if t is odd we use val - close value. Otherwise, we use the val + close value. Remember, all the 5 parameters are float date type. Remember, all the 5 parameters are float date type.
Create dataset and set to the chart
After done with preparing the entries, we need to set the candle data set from the entries and give label information. We also set the axis dependency to left using this line candleDataSet.setAxisDependency(YAxis.AxisDependency.LEFT);. We set the shadow color to gray and shadow width with 0.5f value. To be able to see the charts low or high easily we need something to differentiate the part of the chart if it is low or high. Usually, the high is green and the low is red. So, we set increasing color to green and set paint style to fill. And we set the decreasing color to green and set paint style to fill though. Also, set neutral color to blue. To make all of this happens. Write down these codes.
CandleDataSet candleDataSet = new CandleDataSet(entries, "BTC markets");
candleDataSet.setAxisDependency(YAxis.AxisDependency.LEFT);
candleDataSet.setShadowColor(Color.GRAY);
candleDataSet.setShadowWidth(0.5f);
candleDataSet.setDecreasingColor(Color.RED);
candleDataSet.setDecreasingPaintStyle(Paint.Style.FILL);
candleDataSet.setIncreasingPaintStyle(Paint.Style.FILL);
candleDataSet.setIncreasingColor(Color.GREEN);
candleDataSet.setNeutralColor(Color.BLUE);
I give the label "BTC markets". Remember, this is just an example. Now, we will create our candle data from the data set we created earlier. Then, we set the data to our chart and invalidate the chart to refresh. Don't forget to get the reference from our defined layout first. Write this code.
CandleStickChart candleStickChart = findViewById(R.id.candle_stick_chart);
CandleData candleData = new CandleData(candleDataSet);
candleStickChart.setData(candleData);
candleStickChart.invalidate();
After you have done, you can run your app. Then, see the result. It should looks something like this.

Congratulations, you have completed this tutorial. You can also use this library to implement another chart like line, bar, combined, scatter, bubble, etc. This can help you easily integrate statistic of a specific thing.
Posted on Utopian.io - Rewarding Open Source Contributors
@andrixyz, I like your contribution to open source project, so I upvote to support you.
Your contribution cannot be approved because it does not follow the Utopian Rules, and is considered as plagiarism. Plagiarism is not allowed on Utopian, and posts that engage in plagiarism will be flagged and hidden forever.
LINKS:
https://constraintlayout.com/layouts/percentlayout.html
https://constraintlayout.com/layouts/linearlayout.html
You can contact us on Discord.
[utopian-moderator]