What Will I Learn?
- Integrate project via gradle
- Creating the layout of chart
- Fill data set and attach data to the chart
Requirements
- Android Studio 3.0 (recommended)
- Understanding of Java programming language
- Gradle dependencies
- Basic layouting with android development
Difficulty
- Basic
Tutorial Contents
Pie chart is a circular statistical graphic which is divided into slices to illustrate numerical proportion. It is usually help some companies to track their product statistics. For example, how many products were sold, view, redeemed and so on. Also, the statistic can be of any categories like office, home, furniture, etc. In this tutorial, you will learn how to implement piechart using some datas that we'll fill. Let's get started.
Integrate the project via gradle
First of all, we need to go to project level build.gradle. Notice on image below that has highlighted build.gradle. If you wanna see hierarchy like this, click the dropdown and choose Android.
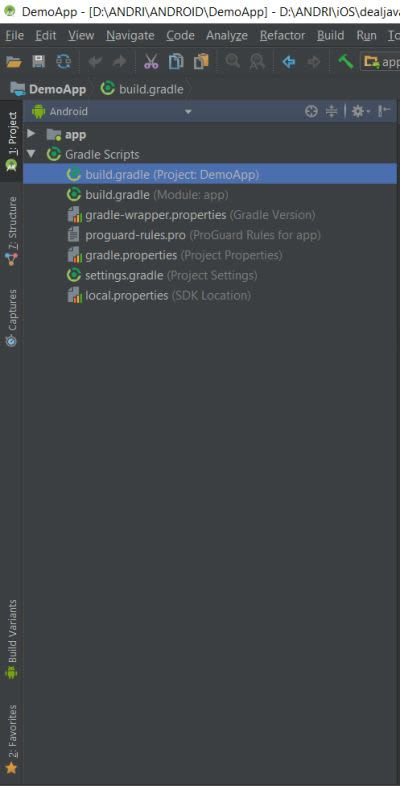
Click the hightlighted build.gradle(Project:DemoApp). The DemoApp name is depend on your project name. Put the maven { url "https://jitpack.io" } line into each repositories section inside respectively of buildscript and allprojects section. It will looks like this.

We also need to add the implementation of library using this line implementation 'com.github.PhilJay:MPAndroidChart:v3.0.3' to add the dependency to our app. Add inside the dependencies section. Make sure add this line in build.gradle (module:app) and notice the implementation highlighted line. It will looks like this.

After done, press sync and wait until finish. We will be able to use the library.
Creating the PieChart using layout
Go to your layout file that corresponding to your Java class later. We'll create the layout using XML. We'll place the PieChart in middle of screen using constraint layout as its parent. Write down this code.
<?xml version="1.0" encoding="utf-8"?>
<android.support.constraint.ConstraintLayout xmlns:android="http://schemas.android.com/apk/res/android"
    xmlns:app="http://schemas.android.com/apk/res-auto"
    xmlns:tools="http://schemas.android.com/tools"
    android:id="@+id/container"
    android:layout_width="match_parent"
    android:layout_height="match_parent"
    tools:context="com.professional.andri.demoapp.MainActivity">

    <com.github.mikephil.charting.charts.PieChart
        android:id="@+id/pie_chart"
        android:layout_width="match_parent"
        android:layout_height="match_parent"
        app:layout_constraintBottom_toBottomOf="parent"
        app:layout_constraintBottom_toTopOf="parent"
        app:layout_constraintLeft_toLeftOf="parent"
        app:layout_constraintRight_toRightOf="parent" />

</android.support.constraint.ConstraintLayout>
It will displays "no charts data available" because we haven't set any data to the chart. Note that we are using constraint to left, right, top and bottom to parent which is equal to center of the screen.

Let's go to fill in the data set and set data to the chart.
Fill in the data set and attach the data to Pie Chart
We always need data to analyze what we want to track and log. So, we must first create the data that will represent in the pie chart. Go to your corresponding activity/fragment Java class, first get the reference of chart that will be used later. Use this line PieChart pieChart = findViewById(R.id.pie_chart);. In this context, i am using activity. Then, we need to provide some datas. I created some arrays of products name, products sold and product colors. Write this code to set the data. Of course, you can change depend on your need.
float[] productSold = {300, 1000, 2500, 1200};
String[] productNames = {"Furniture", "Cosmetic", "Food", "Ticket"};
Integer[] productColors = {Color.DKGRAY, Color.RED, Color.GREEN, Color.BLUE};
We 'll create the pieEntries and colors arraylist to add the pie data and colors to the chart. Let's create those arrays.
ArrayList<PieEntry> pieEntries = new ArrayList<>();
ArrayList<Integer> colors = new ArrayList<>();
After created the arrays, we will loop to add data to the pieEntries with the provided data above that consist of productSold, productNames, productColors. Write this code.
for(int i = 0;i<productNames.length;i++) {
            PieEntry pieEntry = new PieEntry(productSolds[i], productNames[i]);
            pieEntries.add(pieEntry);
            colors.add(productColors[i]);
}
Note we are using integer to colors because Integer represents the color. Let's go to the next step.
We are going to create the PieDataSet first and set the colors we have provided above. Write this code.
PieDataSet pieDataSet = new PieDataSet(pieEntries, "Products Statistics");
pieDataSet.setColors(colors);
Then, we need to create the PieData and attach pie data set we have created above to the Piedata and i will disable default description to the pieChart by using these codes.
PieData pieData = new PieData(pieDataSet);
pieData.setDataSet(pieDataSet);
pieChart.getDescription().setEnabled(false);
Then, the last step is to set the pieData to the chart and refresh the chart to display what we have provide in the data including productSold, productNames, productColors using code below.
pieChart.setData(pieData);
pieChart.invalidate();
The result will be looks like this.

You can see that we have 4 category data that represents ticket, cosmetics, furniture and food. The most sold is the food product with 2500 and the minimum sold is the furniture which is only 300. Note that this is just the raw value. We also can change the value to percentage by multiply 100 and divide by the total products. If you want something like that, first sum all of the products sold and modify the code that we add data to pieEntries. But, let's get started with the sum of all products.
float totalSold = 0;
for(int i=0;i<productSolds.length;i++){
       totalSold += productSolds[i];
}
Then, we modify the product sold when we are add to the entries like this
for(int i = 0;i<productNames.length;i++) {
            float soldPercentage = productSolds[i] * 100 / totalSold;
            PieEntry pieEntry = new PieEntry(soldPercentage, productNames[i]);
            pieEntries.add(pieEntry);
            colors.add(productColors[i]);
}
Notice the soldPercentage variable that we first multiply by 100 and divide by product sold. Then we set the formatter using percent formatter.
pieData.setValueFormatter(new PercentFormatter());
After done run your app. You should see the final result like this.

This is the final code.
package com.professional.andri.demoapp;

import android.graphics.Color;
import android.os.Bundle;
import android.support.v7.app.AppCompatActivity;

import com.github.mikephil.charting.charts.PieChart;
import com.github.mikephil.charting.data.PieData;
import com.github.mikephil.charting.data.PieDataSet;
import com.github.mikephil.charting.data.PieEntry;
import com.github.mikephil.charting.formatter.PercentFormatter;

import java.util.ArrayList;

public class MainActivity extends AppCompatActivity {

    @Override
    protected void onCreate(Bundle savedInstanceState) {
        super.onCreate(savedInstanceState);
        setContentView(R.layout.activity_main);

        PieChart pieChart = findViewById(R.id.pie_chart);

        float[] productSolds = {300, 1000, 2500, 1200};
        String[] productNames = {"Furniture", "Cosmetic", "Food", "Ticket"};
        Integer[] productColors = {Color.DKGRAY, Color.RED, Color.GREEN, Color.BLUE};

        float totalSold = 0;
        for(int i=0;i<productSolds.length;i++){
            totalSold += productSolds[i];
        }

        ArrayList<PieEntry> pieEntries = new ArrayList<>();
        ArrayList<Integer> colors = new ArrayList<>();
        for(int i = 0;i<productNames.length;i++) {
            float soldPercentage = productSolds[i] * 100 / totalSold;
            PieEntry pieEntry = new PieEntry(soldPercentage, productNames[i]);
            pieEntries.add(pieEntry);
            colors.add(productColors[i]);
        }

        PieDataSet pieDataSet = new PieDataSet(pieEntries, "Products Statistics");
        pieDataSet.setColors(colors);

        PieData pieData = new PieData(pieDataSet);
        pieData.setValueFormatter(new PercentFormatter());
        pieData.setDataSet(pieDataSet);
        pieChart.getDescription().setEnabled(false);
        pieChart.setData(pieData);
        pieChart.invalidate();


    }
}
And it's done. That's how we convert to percentage. Congratulation of completing this PieChart guide. This PieChart can help many developers to easily integrate statistics, analytics and so on. Thanks for following this tutorial.
Posted on Utopian.io - Rewarding Open Source Contributors
Thank you for the contribution. It has been approved.
You can contact us on Discord.
[utopian-moderator]
Hey @andrixyz I am @utopian-io. I have just upvoted you!
Achievements
Community-Driven Witness!
I am the first and only Steem Community-Driven Witness. Participate on Discord. Lets GROW TOGETHER!
Up-vote this comment to grow my power and help Open Source contributions like this one. Want to chat? Join me on Discord https://discord.gg/Pc8HG9x