In this tutorial I'll show you how to use Chart.js to visualize your data. If you want to visualize data in your site I recommend to use this library. this library is simple, easy-to-use and flexible javascript charting to develop your site. But, before we start to use this library we prepare the data sample to visualize in chart.js. here is monthly revenue as data sample:
| Month | Revenue |
| Jan | 165 |
| Feb | 259 |
| Mar | 320 |
| Apr | 181 |
| May | 365 |
| Jun | 555 |
| Jul | 640 |
Installing
To installing chart.js we can use npm, bower or with CDN:
NPM
npm install chart.js --save
Bower
bower install chart.js --save
Then we need import the library in this case installing chart js using CDN and put script tag before end of the body tag.
<html>
<head><title>Using Chart.JS<title></head>
<body>
  <script src="https://cdnjs.cloudflare.com/ajax/libs/Chart.js/2.7.1/Chart.min.js"></script>
</body>
</html>
Now chart.js has been installed, we can start to use this library
Usage
In this tutorial I make 3 sample of chart.js that is Line chart, Bar chart, and Doughnut. To use this library is very simple we just use element or context from chart.js class and the we configure data in javascript tag. Here is element class to create three chart:
<html>
<head><title>Using Chart.JS<title></head>
<body>
  <p>
  <img src="http://www.chartjs.org/img/chartjs-logo.svg"> <h1>ChartJS</h1>
  </p>
<div>
  <canvas id="lineChart" height="400vw" width="400vw"></canvas>
  <canvas id="barChart" height="400vw" width="400vw"></canvas>
  <canvas id="doughnutChart" height="400vw" width="400vw"></canvas>
</div>
  <script src="https://cdnjs.cloudflare.com/ajax/libs/Chart.js/2.7.1/Chart.min.js"></script>
</body>
</html>
In this code we initialize 3 chart with canvas tag but not finish yet with this code, because this chart class just container element to rendering the pre-defined chart-type or create your own. This code looks like:
Now, to defined chart type we need configuration data and chart option in javascript tag.
First, we configure option for each chart in this case we group the option in one variabel called option. Here's the code:
<script>
var option = {
  responsive: false,
  scales: {
    yAxes: [{
      stacked: false,
      gridLines: {
        display: true,
        color: "rgba(255,99,132,0.2)"
      }
    }],
    xAxes: [{
      gridLines: {
        display: false
      }
    }]
  },
  tooltips: {
      cornerRadius: 0,
      caretSize: 0,
      xPadding: 16,
      yPadding: 10,
      backgroundColor: 'crimson',
      titleFontStyle: 'normal',
      titleMarginBottom: 15
    }
};
</script>
In this code we configuration the background chart and tooltip chart when mouse hoevr on the chart content. then we need define the data sample to show the value of chart content. in this case I make two sample data and initialize the data with 2 variabel called data and multiColorData. Here's the code
var data = {
  labels: ["Jan", "Feb", "Mar", "Apr", "May", "Jun", "Jul"],
  datasets: [{
    label: "Revenue",
    backgroundColor: "lightsteelblue",
    borderColor: "rgba(255,99,132,1)",
    borderWidth: 0,
    hoverBackgroundColor: "cadetblue",
    hoverBorderColor: "rgba(255,99,132,1)",
    data: [165, 259, 320, 181, 356, 555, 640],
  }]
};
var multiColorData = {
  labels: ["Jan", "Feb", "Mar", "Apr", "May", "Jun", "Jul"],
  datasets: [{
    label: "Revenue",
    backgroundColor: ["lightsteelblue","red","green","blue","crimson","violet","cyan"],
    borderColor: "rgba(255,99,132,1)",
    borderWidth: 0,
    hoverBackgroundColor: "cadetblue",
    hoverBorderColor: "rgba(255,99,132,1)",
    data: [165, 259, 320, 181, 356, 555, 640],
  }]
};
In data variable just define the dataset with static background color and multiColorData variable defined the multi color static background color. In this variable every dataset have a different color. The last we just put the option and dataset variable to canvas tag. Here's the code:
Chart.Line('lineChart', {
options: option,
data: data
});
Chart.Bar('barChart',{
options: option,
data: multiColorData
});
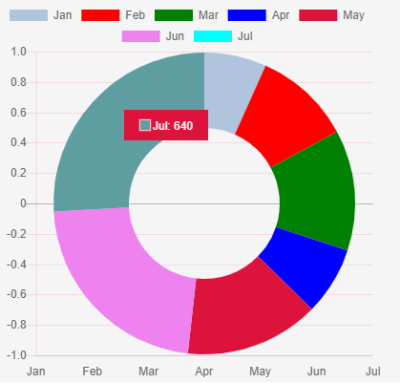
Chart.Doughnut('doughnutChart',{
options: option,
data: multiColorData
});
This code initialize every canvas with the value of variables. On Line chart just initialize with static background color that is data variable and option variabel as default option all canvas chart. For bar chart and doughnut we use multiColorVariabel dataset to showing chart with different color each data content. It's look like:
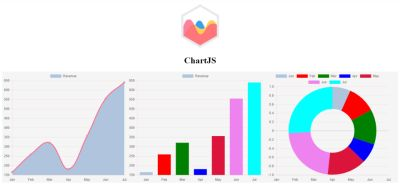
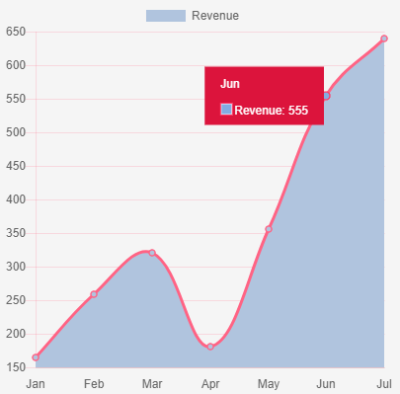
Line Chart
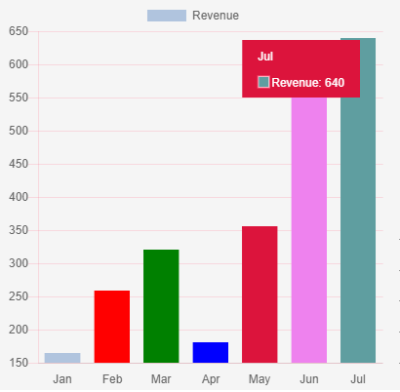
Bar Chart!
Doughnut
Conclusion
This tutorial just propiveda basic introduction of the Chart.js library and showed you how to use it to create line, doughnut and bar charts. You also learned about different configuration options and dataset that can be used to control the appearance of different charts. For more the configuration options to apllied all chart types, you can see documentation on official site Chart.js.
To demo and explore this tutorial you can debug here:
See the Pen ChartJS by Rio Dwi Prabowo (@riyos94) on CodePen.
Thank you
Posted on Utopian.io - Rewarding Open Source Contributors
Hey @riyo.s94 I am @utopian-io. I have just upvoted you!
Achievements
Suggestions
Get Noticed!
Community-Driven Witness!
I am the first and only Steem Community-Driven Witness. Participate on Discord. Lets GROW TOGETHER!
Up-vote this comment to grow my power and help Open Source contributions like this one. Want to chat? Join me on Discord https://discord.gg/Pc8HG9x
Thank you for the contribution. It has been approved.
You can contact us on Discord.
[utopian-moderator]
You are welcome.
Thank you @shreyasgune