
Friends and foes, welcome to this analysis of VEN-USD.
I have analysed the daily chart of VeCHAIN with the best of my knowledge and i am posting the statistics here. Please note that i am learning TA and i am using this article as a log for my progress. This is not an investment advice. Invest your capital at your own risk.
So, without any further ado, let’s get started.
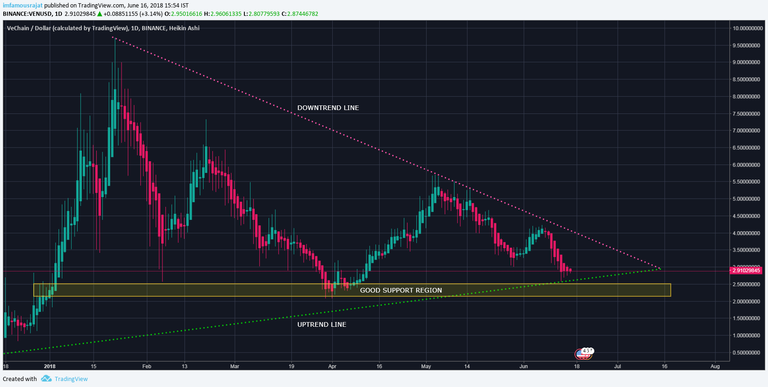
I am using Heikin Ashi candles for this chart only just to show the trend. Below is the daily VEN-USD graph with the next possible support marked. The price has been moving inside the symmetrical triangle since long time and is about to reach the completion point.
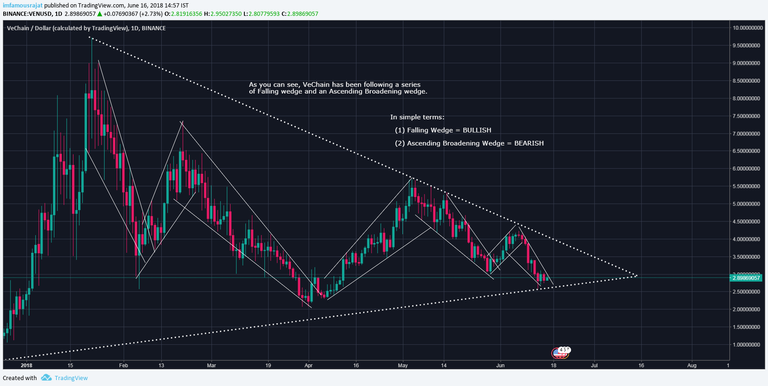
Also, as you can see, VeChain has been following a series of Falling wedges and an Ascending Broadening wedges inside a symmetrical triangle. The outcome of this movement in the triangle can be either break upwards or break downwards and is expected to occur anywhere in between 2-3 weeks.
In simple terms:
(1) Falling Wedge = BULLISH
(2) Ascending Broadening Wedge = BEARISH
EMA + RSI
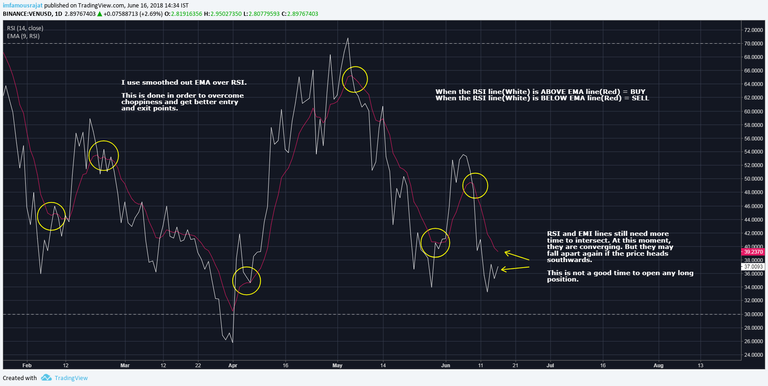
I use smoothed out EMA over RSI. This is done in order to overcome choppiness and get better entry and exit points.
Just remember,
If the RSI line(White) is ABOVE EMA line(Red) = BUY
If the RSI line(White) is BELOW EMA line(Red) = SELL
So, as it is clear from the graph, the RSI and EMI lines still need more time to intersect. At this moment, they are moving towards each other. But they may fall apart again if the price heads southwards.
This is not a good time to open any long position.
WILLIAMS ALLIGATOR
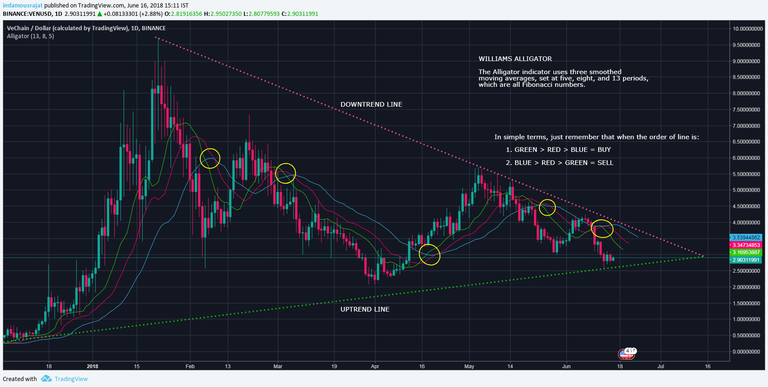
The Williams alligator shows signs of further downward movement.
Basically, The Alligator indicator uses three smoothed moving averages, set at five, eight, and 13 periods, which are all Fibonacci numbers. The initial smoothed average is calculated with a simple moving average (SMA), adding additional smoothed averages that slow down indicator turns.
In simple terms, just remember that when the order of line is:
1. GREEN > RED > BLUE = BUY
2. BLUE > RED > GREEN = SELL
Also, this is a lagging indicator. So, don’t reply on this one solely. Use it as a supplement with other indicators for more accurate results.
MACD
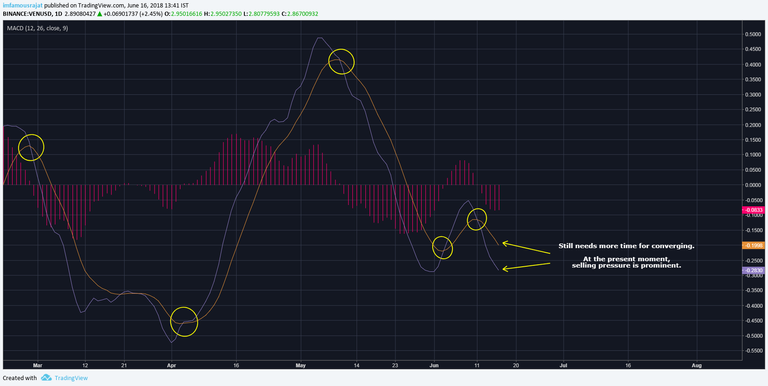
MACD is showing prominent selling and needs more time to give buying signal.
ADX AND DI
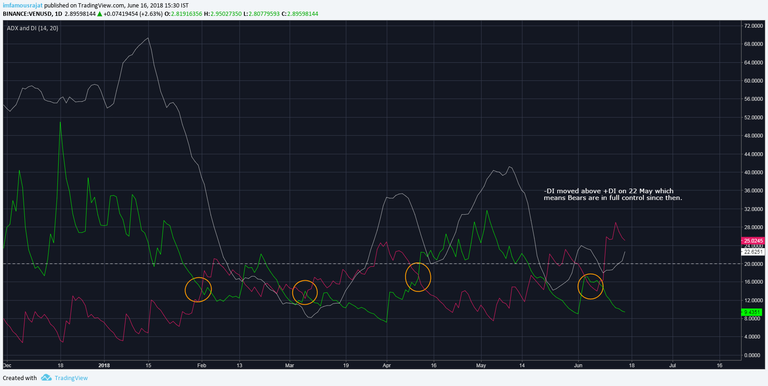
-DI moved above +DI on 22 May which means Bears are in full control since then. Expect Bearish movement to continue.
VORTEX INDICATOR
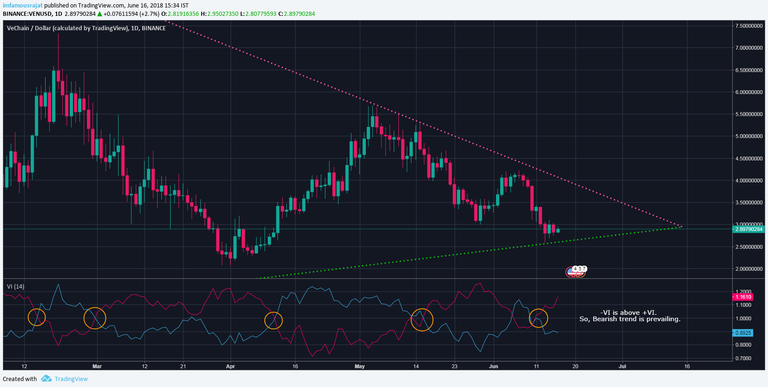
-VI is above +VI.
So, Bearish trend is prevailing.
Keep in mind that Vortex indicator is a lagging indicator. So, use this one too with other indicators as a supplement.
CONCLUSION:
I’ll leave it for you to decide. I am neither shorting nor longing at this moment, i am just sharing this for knowledge purposes only.
P.S: This is not an investment advice, and i am just learning. This is for my learning purpose only. Invest your capital at your own risk.
Those who wish to achieve greatness, never seek for permissions. They follow what their heart says,
and do what their mind states!
Good luck trading.!
Peace.
If you find this article/information helpful, be sure to leave an upvote and share with all your friend.