Thats a good analysis on bitcoin and it will be better for us to add explanation further with the chart and also it will be very helpful for the newbies....keep it up...
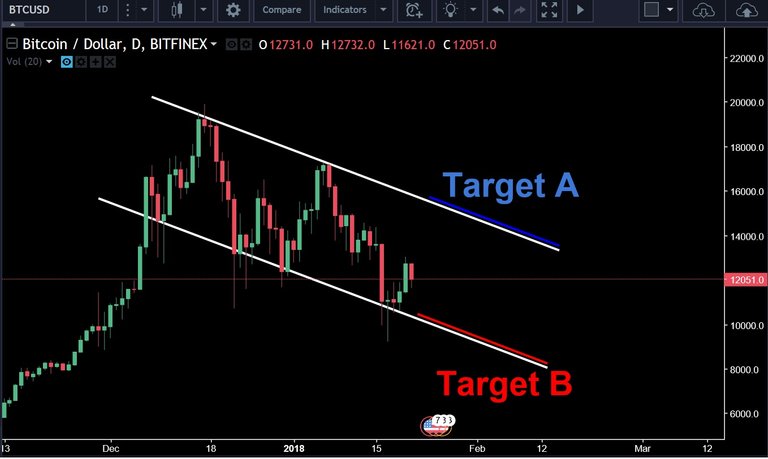
thank you. it will be hard for me to explain this analysis because I will have to explain my technique. but basically the highs have a certain angle. same angle is applied to the lows. when the lows are not solid you take the average number of the lowest points and then apply the support. then you have to check the markets positivity among the buyers and the sellers on social networks.
with this analysis you can act is two ways. the first is to buy B target and sell when it reaches A. and the second way is split your position 50/50 (50% btc 50%usd) and wait for the chart to cross A/B target and then act according to the cross. buy if it crosses A and sell if it crosses B
Thats a good analysis on bitcoin and it will be better for us to add explanation further with the chart and also it will be very helpful for the newbies....keep it up...
thank you. it will be hard for me to explain this analysis because I will have to explain my technique. but basically the highs have a certain angle. same angle is applied to the lows. when the lows are not solid you take the average number of the lowest points and then apply the support. then you have to check the markets positivity among the buyers and the sellers on social networks.
with this analysis you can act is two ways. the first is to buy B target and sell when it reaches A. and the second way is split your position 50/50 (50% btc 50%usd) and wait for the chart to cross A/B target and then act according to the cross. buy if it crosses A and sell if it crosses B