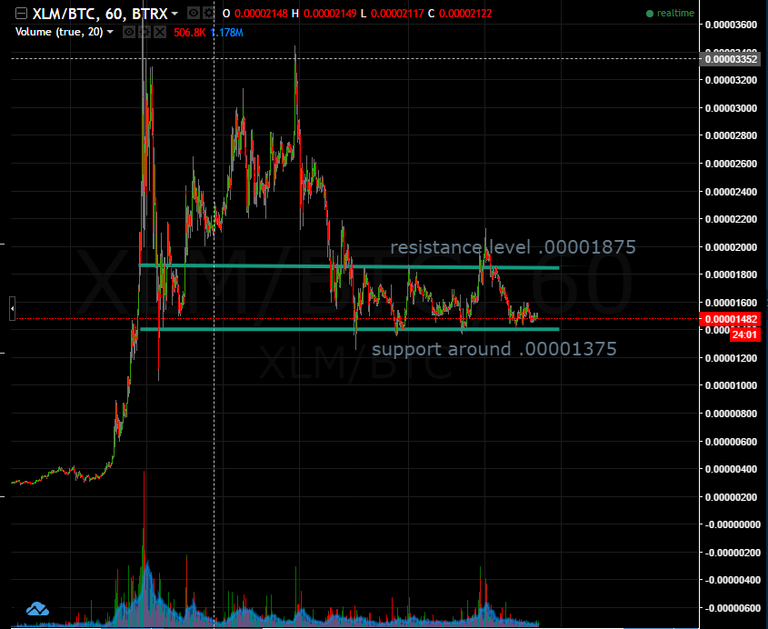
I like the way the chart looks for XLM and I am looking to add it in the near future. It has been consolidating and finding new support after the recent breakout. It looks like it has found support around the .00001375 and resistance at .00001875. This could be a good short term swing play ~ a 20% gain. It is currently at .00001482, I am going to add it if it drops anywhere close to .00001400.
If it breaks the resistance up around .00001875 it could have a huge breakout again possibly testing the .00002200 level. The market has been volatile lately so I am going to make sure to be careful and watch these price indicators that I feel are important.
I will post updates if I decide to add!
I am just learning to chart, so any feedback is appreciated - I would love to learn more and hear others opinions