UPDATE Feb 18, 2020
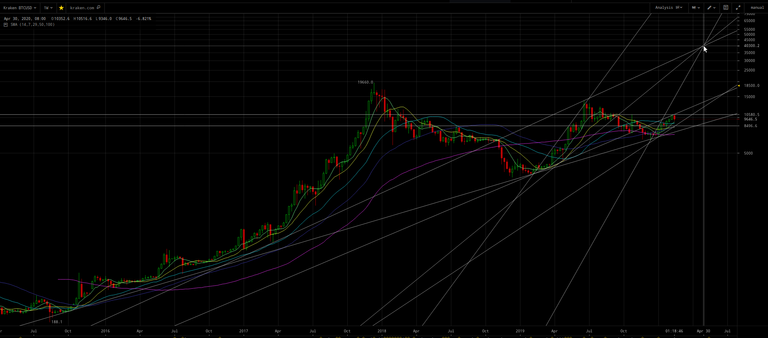
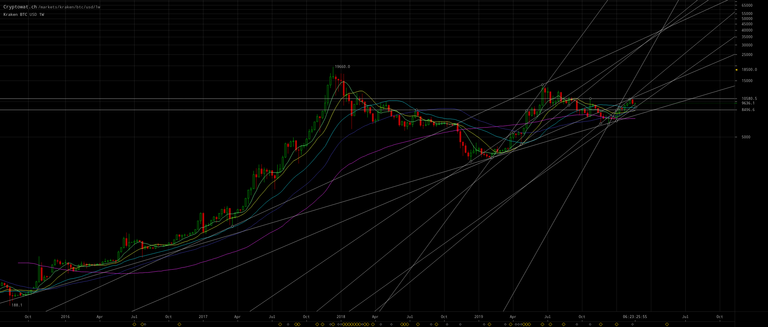
Keep the big picture of the repeating fractal pattern and incredible bullishness of Bitcoin in mind:
(click to zoom)
Here’s a copy of the above chart with selected price points displayed (if zoomed of course) for annotated lines to help you understand which annotated lines correspond to the analyses below:
(click to zoom)
(Tangentially on above chart note the golden cross of purple 50 up over the magenta 100 WMA, which instead was death cross under in 2019!)
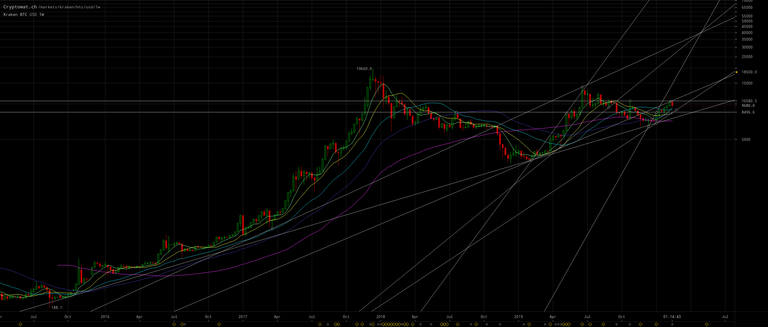
Here’s the 3D (three day) version of above chart:

(click to zoom)
The annotated horizontal lines point out the fractal correspondence between the current cup & handle pattern with the one in 2019 which led to the $13.9k peak. Note how the cup comes up to the peak prior to the cup before forming the handle.
After the handle (correction), there’s a blow-off, parabolic move to another peak before a new decline and cup & handle ensues. Consecutive fractal patterns are become smaller and more accelerated, but these affine relationships also exist within larger scale self-similarity as can also be seen by zooming in/out on Mandelbrot sets.
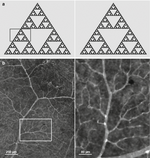
So the difficult part which requires a high visual mathematical IQ, is that the current peak and correction — which forms the handle of the cup at the scale in which this current juncture corresponds to May 2019 — also corresponds to both peaks in February and April 2019 at other scales of the self-similar fractal pattern. Think of a Matryoshka doll:


(click to zoom)

Self-similarity - Wikipedia
So fractal pattern correspondence of the current juncture to late June 2019 $13.9k top (which forms the ongoing handle correction for the larger fractal pattern correspondence) is 3X to 5X accelerated, i.e. 0.33 (⅓) to 0.2 (⅕) of duration. Thus we can expect this correction to be between 0.33 × 0.33 = 0.11 to 0.2 × 0.2 = 0.04 the duration of the ~7 months correction in 2019 from the $13.9k peak to the $6.5k bottom. Thus 1 to 4 weeks for this current handle correction, which began on February 17.
Since this current juncture handle correction also has correspondence to either February 2019 (per the LTC/BTC pattern correspondence mentioned in this blog) or April 2019 (per the bullish, golden crosses of green 50 to yellow 100 and cyan 200 DMA) on the larger (broader) scale fractal pattern, thus a decline to or slightly below the 50 DMA is likely.
Note for my annotated trend lines on the first chart above that the prior $13.9k peak occurred at the junction of the — long-term trend line from the kickoff of the bullish move to the $19.7k peak prior to the $13.9k peak — and the trend line from the kickoff of the bullish move to the said $13.9k peak. And the corresponding ~$40k junction April 30, 2020 of the — trend line from the kickoff of the bullish move to the $13.9k peak prior to the current juncture coming peak — and the trend line from the kickoff of the bullish move to the current juncture coming peak!
That ~$40+k peak just before the May 14, 2020 Bitcoin mining reward halving event, it strongly suggestive of my posited Segwit donations attack on the impostor Bitcoin Core.
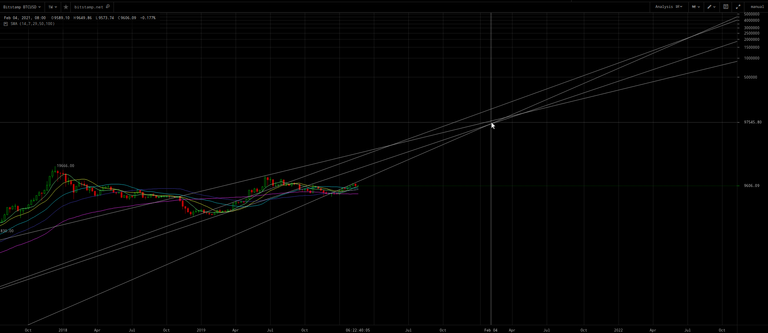
I added two trend lines to the following chart as compared to the first chart above, one which intersected at a confluence junction which predicted the $13.9k peak as shown (Bitstamp exchange):
(CLICK TO ZOOM)
The other added trend line is parallel to the trend line it would need to intersection to predict a peak price after $40k by April 30. This projects the next peak price after the May 14, 2020 halving event is infinite U.S. dollars! This seems to confirm the posited Segwit attack valuation model.
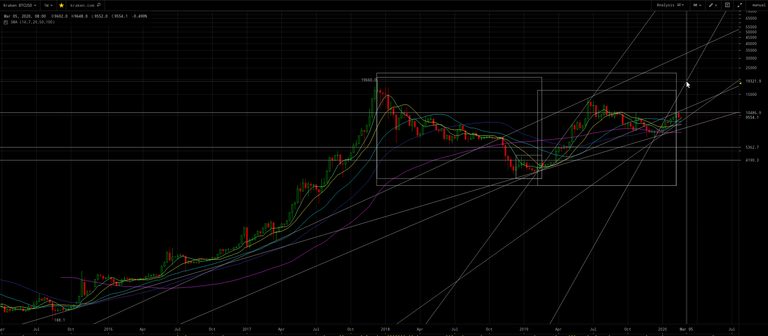
Here are the four pertinent trend lines for easier visualization (Kraken exchange):

(CLICK TO ZOOM)
IOW, Bitcoin eventually becomes the new world reserve currency asset and U.S. dollar dies, as I have predicted in many of my blogs such as:
- Get Ready for a World Currency
- Bitcoin rises because land is becoming worthless
- Facebook’s Libra + Bitcoin + Trump + Israel = 666 Orwellian Dystopia
- Phoenix rises in 2020; all altcoins (including Bitcoin Core) will be 50+% attacked/destroyed
Note if I draw one of the trend lines in another position, there’s seems to be a ~$100k confluence junction February 2021, which I interpret to apply perhaps to Craig Wright’s BSV or to recovery of the posited impostor Bitcoin Core after Core is forced to hardfork (aka hardfuck) it to lower the difficulty so blocks can be mined every 10 minutes instead of once a month or so (although I think the Core chain will be continually 50+% attacked after the Segwit donations attack siphons away all the miners to legacy):

(CLICK TO ZOOM)
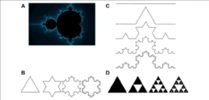
The self-similarity (two rightmost boxes and separately two leftmost boxes) fractal pattern depicted below also crudely (because non-linear, affine projection) linearly projects congruently 38 days × 24 months ÷ 14 months = 65 days + Feb. 17, 2020 =Apr. 22, 2020 and ($10.5k − 6.4k = $4.1k ÷ 6.4k = 0.64) ÷ ($4190 − 3330 = $860 ÷ 3330 = 0.26) = 2.5 × ($5.5k - 4.2k = $1.3k ÷ 4.2k = 0.31) × $10.5 = $8.1k + $10.5 =$18.6k:
(CLICK TO ZOOM)
As marked with the mouse on the above chart, I expect that $15+k price in March due to the acceleration of cumulative fractal patterns combined.
Legacy Bitcoin can plausibly attain a $1 million price in 2020, posited to be due to the stock-to-flows valuation model and the acceleration of feeding miners ~100+ Segwit donated BTC per mined block:

(click to zoom)
Bitcoin Handle Correction
BTC/USD is rallying up to the resistance of the bottom of the bearish, rising wedge it fell out of and also to the overhead resistance which was the support line from the start of the bull market on February 7, 2019:
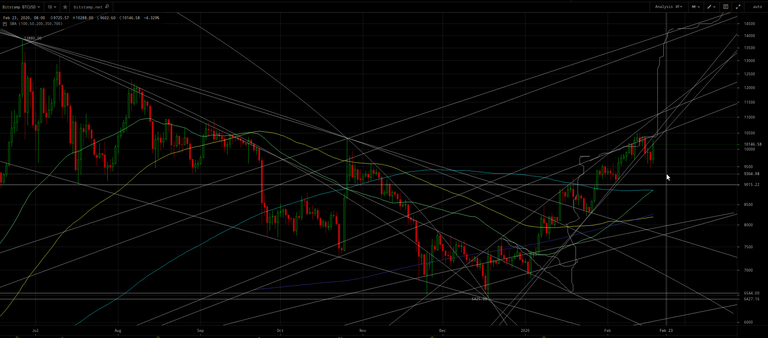
(click to zoom)
I’m anticipating another decline after bouncing to ~$10.5k, to a lower low between the strong horizontal confluence zone at $9kand the 50 DMA at ~$9300 no later than February 24.
Markets move in the direction that takes the most money from the most people. The recent shift of some to a more bullish posture and the FOMO fervor that’s starting to brew for example for ETH, probably requires a significant spike low to trigger many stop-losses to gain the base-camp fuel to propel much higher.
Filb filb (and a trader going by ‘George’) concur with the timing of this possibility (although last I checked he leans bullish):
George further explained “Keep it simple, $11,700 is next. Invalidation [if there is a] clean break below $9,500.”
Also, Filb Filb wrote that “every time Bitcoin turns $9,500 to support [on a weekly basis], it goes to $11,500.”
Unfortunately, right now it isn’t clear if Bitcoin will hold $9,500.
Note that the correction started on February 17, so the week will end February 24 although chart weekly may end as of the start of Saturday February 23.
Altcoins
Ethereum
Our first hint as to whether the altcoins will also decline with the posited coming decline of BTC, comes from zooming in on the aforementioned bullish, broadening, rising wedge on the 1H (one hour) ETC/ USD chart:
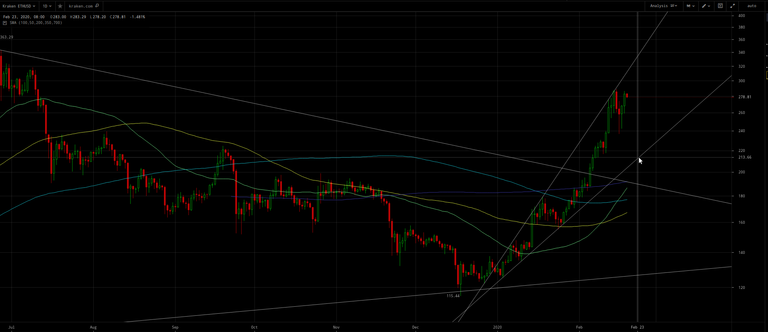
(click to zoom)
ETH/USD is struggling to return back to the overhead resistance at the top of said wedge. And appears to be in a reactionary, deadcat bounce on the way to a further decline to the bottom of said wedge (but not to fall out of the bottom of the bullish wedge). Positing a BTC/USD decline below $9500 by February 23 corresponding to ~$214 at bottom of said ETH/BTC wedge.
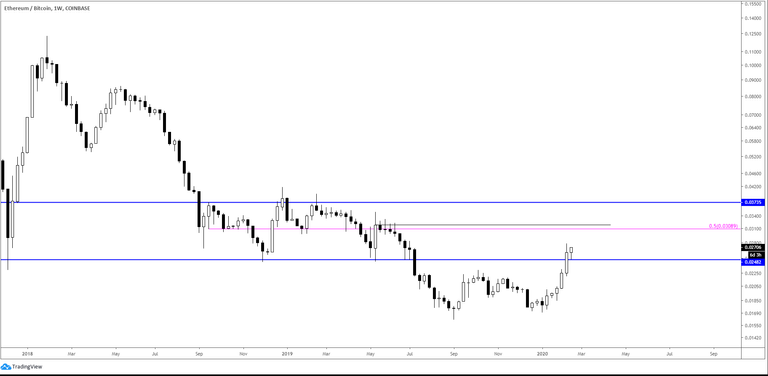
Yet unless BTC simultaneously dropped to $8700 the strong horizontal confluence for ETH/BTC at 0.0246 would fail as support, which might trigger some stop-loss selling:
(click to zoom and read tweet responses)
(click to zoom)
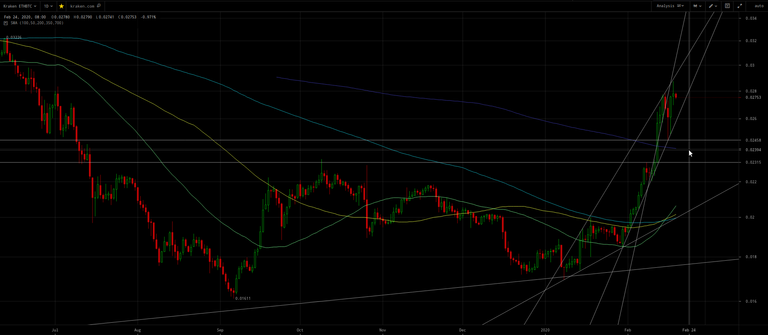
Which with BTC/USD between $9000 and $9300 would drop ETH/BTC towards the more recent horizontal confluence at ~0.0231 and the purple 50 WMA which will be below 0.024 by end of February 23:
(click to zoom)
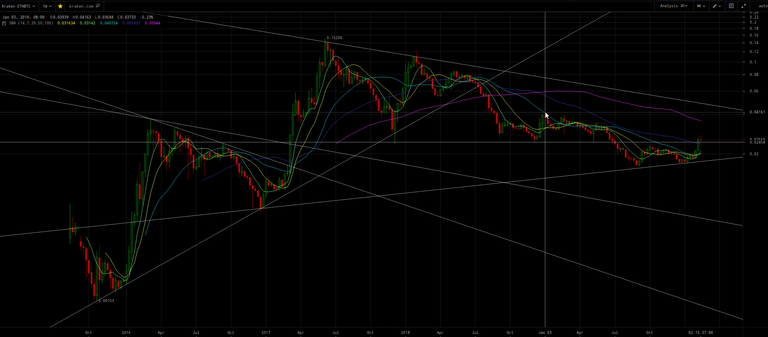
Whereas, if ETH/USD were instead to rocket up to the top of the wedge with BTC/USD flat to slight decline, then ETH/BTC could hit the 0.035 target, although this would likely push out the timing to early March due to an overhead resistance trend line:
(click to zoom)
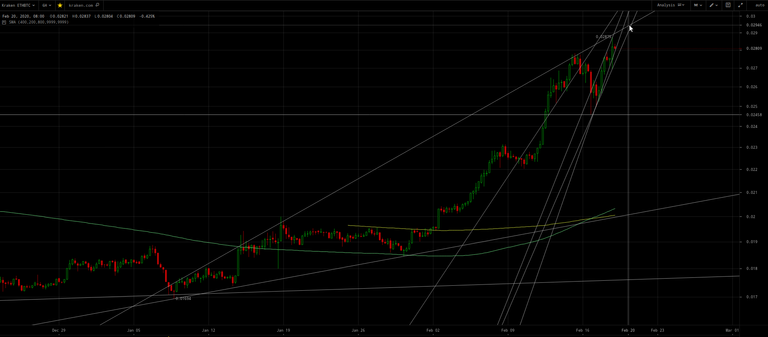
Litecoin
Furthermore LTC/BTC is in a short-term, bearish, rising, narrowing wedge which portends a drop to between 0.0065 and 0.0070:
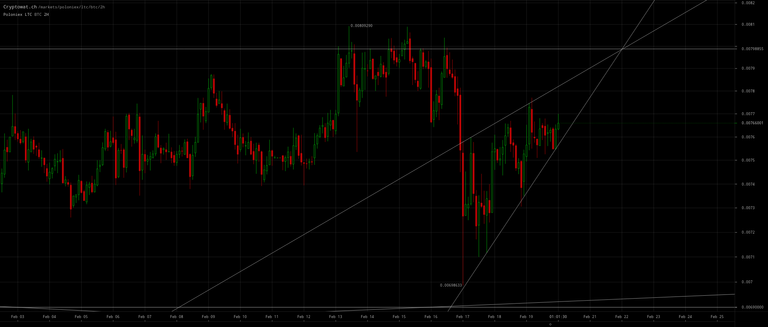
(click to zoom)
(click to zoom)
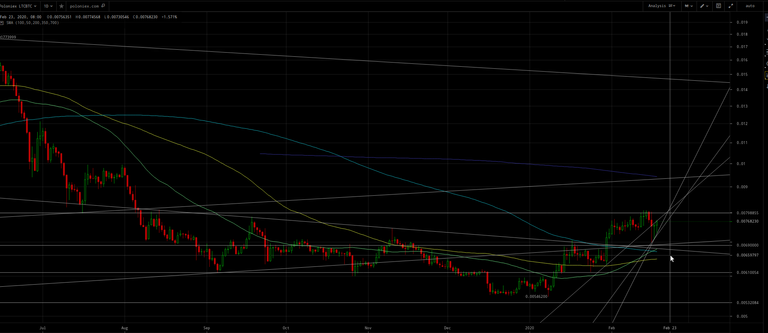
And LTC/USD may drop out the bottom of its bearish, rising, narrowing wedge to a price between horizontal confluence at$56 up to $63 for the projected green 50 DMA (with these posited values congruent with the posited values above for LTC/BTC given the posited values above for BTC/USD):
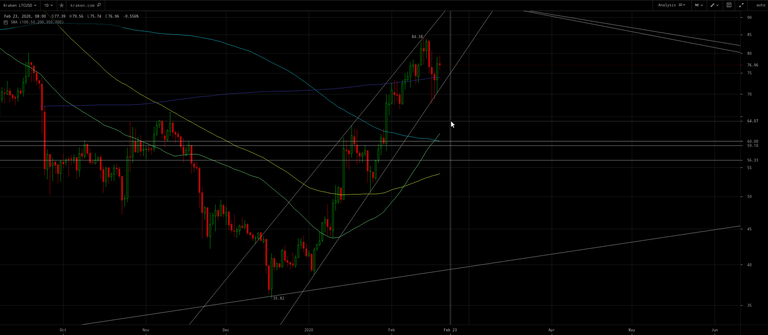
(click to zoom)
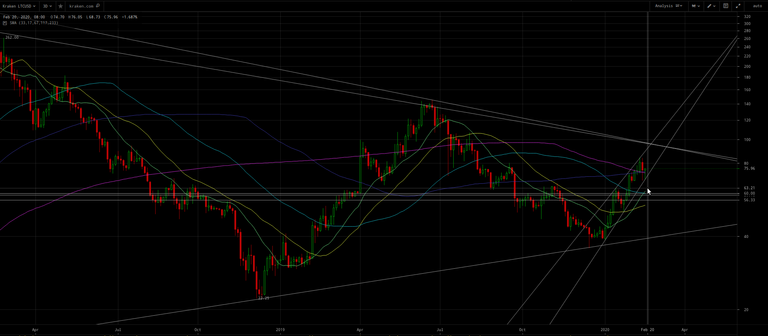
(click to zoom)
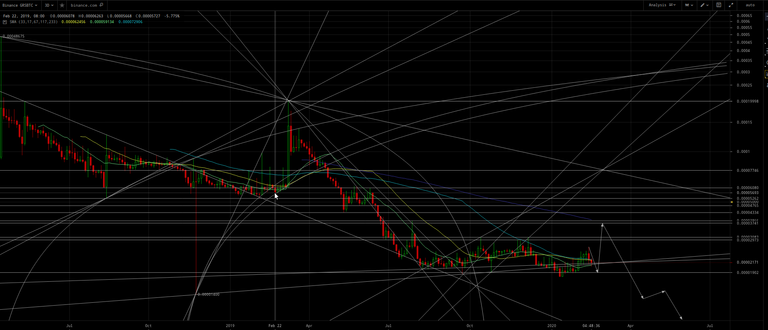
Groestlcoin
Likewise GRS/BTC is tumbling down in consecutive bearish, rising, narrowing wedges towards the ~0.000019 horizontal confluence which corresponds to the fractal pattern from February 22, 2019:
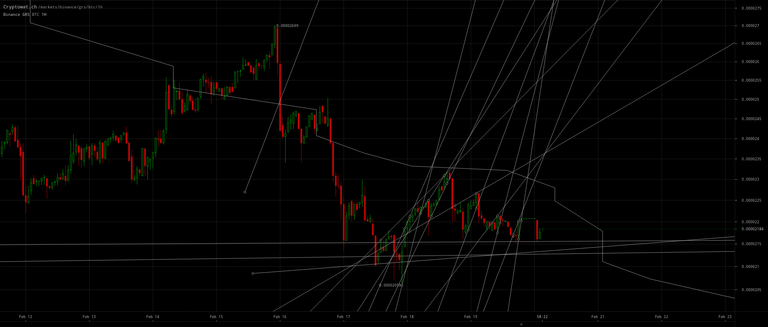
(click to zoom)
(click to zoom)
Same chart as above but with annotated points selected instead of the annotated the February 22, 2019 correspondence:
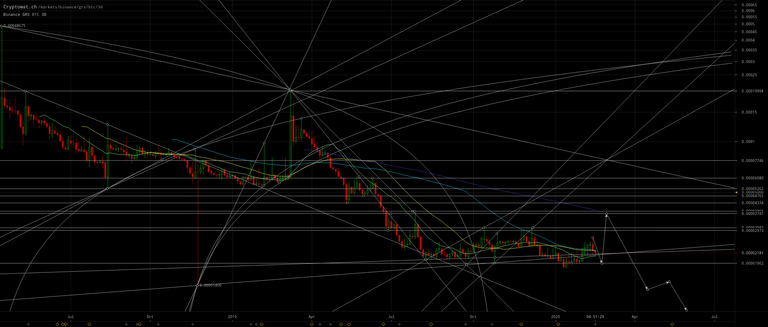
(click to zoom)
Thus strong confluence signals for a spike low between February 20 and 24 before rocketing higher.