This is funny. What about for example with Stratis? A few days ago for short term you predicted $11 and look at it now. I could mention a lot more but it is useless.
You are viewing a single comment's thread from:
This is funny. What about for example with Stratis? A few days ago for short term you predicted $11 and look at it now. I could mention a lot more but it is useless.
You are uninformed.
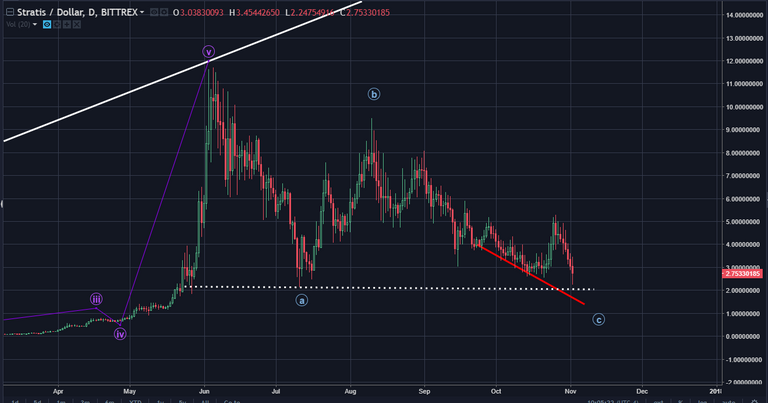
Below is my chart I posted, it's following very well. Where is the marking for wave c? Do you see it? It's heading there first. Then the target. Before commenting, please try and be informed.
What is this?
https://steemit.com/bitcoin/@haejin/strat-update-short-term-target-usd11-03-long-term-target-target-usd140-35x
He literally just posted the chart from that blog post you're linking.....
Check it again.
I see the same chart, one is in log scale and the other is in standard scale.
I see both charts pointing towards an ABC correction for STRAT, roughly in the area of $1.30 USD per coin before the C correction wave might be finished. Again all of this is just an estimation, since no one has the ability to pinpoint numbers with 100% accuracy.
So, two questions for you:
Haejin has stated numerous times that his TA doesn't clearly define timeframes, but rather overall potential movements in a chart that people can look out for.
My understanding is pretty simple, the ABC corrections are not done yet and might not be done until STRAT is in that $1.30 area. STRAT is currently $2.84 so it has a ways to go... perhaps it'll drop further just like all the rest of the alts up until the 2X fork.....? Hmm... maybe.
Where can you see on the updated chart on the post $1.30? One of us is completely blind.
Right click and open the image in the comment, in a new tab. Should be much easier to see the tail of the C correction wave ending roughly around $1.30.
Looks like there is a misunderstanding on what you mean by short term and what is a short term for @haejin. I do not see a problem in charts. 😉
newbie, smh...