Why this is NOT a bull market, at least not yet
While writing this, Bitcoin fell below $11,200 from above $11,400. I posted much of what is in this article on Twitter over the last few days.
All across the cryptosphere, traders are claiming we are in a full on rally. It is funny how just a slight bump in the price of Bitcoin can make people abandon logic and start chasing #lambos and #moonshots like horny teenage boys chasing a piece of ass with a massive erection. Honestly, crypto kids are either all FUD or all FOMO. There is very little realism in the world of crypto, but I digress. The goal of this post is to take an all-encompassing, realistic look at the current state of the cryptocurrency markets--more specifically Bitcoin. My explanation for this jump in Bitcoin's price has to do with alt coin selloffs and FOMO-chasing the bull. Let's get started.
Technical Analysis
You either love it or you hate it. It's either "bullshit" or it is the best way to chase #lambos. Well, honestly both positions are completely wrong. Technical analysis can be useful, but only to a degree. More specifically, the oldest forms of technical analysis are by far the most useful--candle sticks (not patterns) and moving averages. Why are these the most useful when it comes to cryptocurrency technical analysis? Well these methods were formed during emerging markets without much regulation--sound familiar? The more modern forms of technical analysis and their suggested settings are based on decades of stock market behavior, not cryptocurrency market behavior. For example, for all we know RSI length and overbought/oversold conditions should be completely different numbers in crypto. The same can be said about candlestick patterns as well. These patterns were discovered after years of studying the stock market. That's one reason why they are only right about fifty percent of the time.
You may be thinking, "Taint, did you not just invalidate your initial claim about moving averages and candlesticks if they too have been used in the stock market for many many years and not in crypto markets?". Well no, not really. A simple moving average is just an average of closing prices over a span of time. It is basically the same as saying last week, gas was $2.00 per gallon, this week gas is $2.30 per gallon, and adding all seven daily prices together and dividing by 7. You get a better idea of whether or not today's price will stay this high, or come back down to the average. Pretty straightforward and simple. Similarly, candle sticks are just a visual representation of which direction price is moving over certain time frames. This combination is simple, and it allows you to see how far the price is from the average. The further the price of anything moves away from a specified average, the greater the probability that it will correct back down to that average via market forces. This isn't some crazy, chart engulfing indicator setup. It's nice and clean, and it works as expected.
I use a combination of three different simple moving averages set at 50, 100, and 200 periods respectively. I combine this with Bollinger Bands--which are also based on moving averages--and a relative strength index which is sometimes reliable. That's it. I don't spend my time deciphering a bunch of nonsense based on the data trends of a completely different market for the same reason I wouldn't major in pottery if I wanted to be a tax attorney. I spend the rest of my time trying to figure out what works and what doesn't work in crypto. I do weird things like look for signals across different trading pairs like LTCUSD and LTCBTC. Things like well LTCUSD isn't moving in dollar value while BTC price is going up like it normally does. I flip over to LTCBTC and see that it is losing hard and fast. This means LTC is crashing but the dollar value hasn't dropped because the increase in BTC dollar value is offsetting the loss. Things like that.
All that said, I'm going to share with you some of my quirky cryptocurrency analysis. Be warned, I don't really care what anyone has to say about it. I don't claim to be able to predict with crazy accuracy. Anyone who does is full of shit. What I can do is catch things before most of the people trading do--like the most recent bloody shit LTC took before any of the negative news was released. And of course this isn't financial advice and such.
One last thing about technical analysis, it works against you because of rampant market manipulation. I'll be writing a post about this soon.
Let's look at some charts
Take a look at the #BTCUSD chart below.
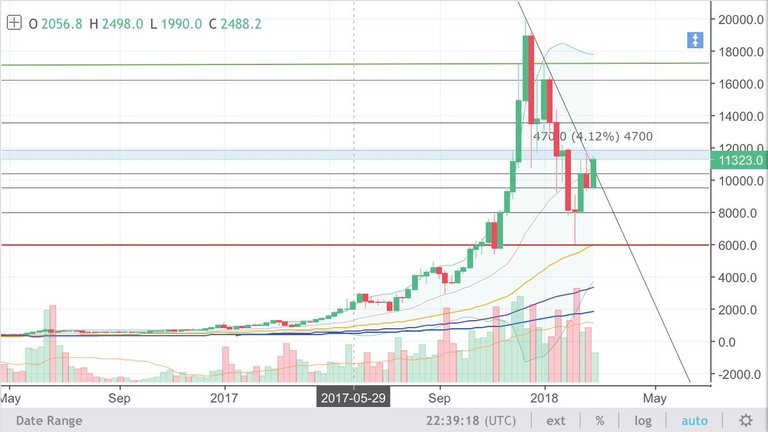
Yes this is a weekly chart, but you can get a much clearer image of the overall price movement on this chart. You can also more easily identify the strongest support/resistance levels/zones. Take a look at the blue area on the chart. This zone starts at around $11,300 and moves up to $11,800. We have support levels at both of the prices. Between these two lies a zone of resistance. $11,800 is the strongest support/resistance level we've seen since the run up to $20,000 BTC. We are testing this zone for the fourth time going up and it was tested three times on the way down.
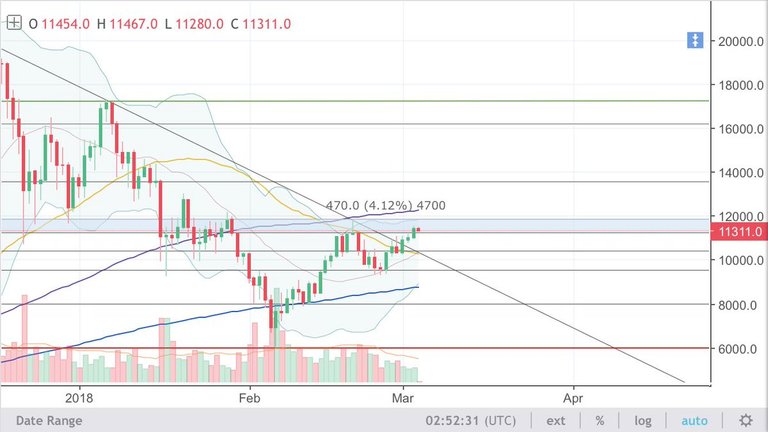
In this shorter time frame, you can better see the "zone" of resistance. You can also see on this daily chart that the 50 period has crossed below the 100 indicating bearish activity. It is headed down to cross the 200 period as well. I actually use a 12 hour chart most of the time. On the 12 hour, we have a "death cross". This is when the 50 period is below the 100 period and the 200 period is above the 100 period--basically the inversion of what is considered bullish. This means the prices over the last 50 periods are lower than both the 100 and 200 combined more less. The price has been moving up and touching the 100 and finding support around the 50. This is VERY bearish.
We have a volume problem as well. Let's back up to before the run up to $20k.
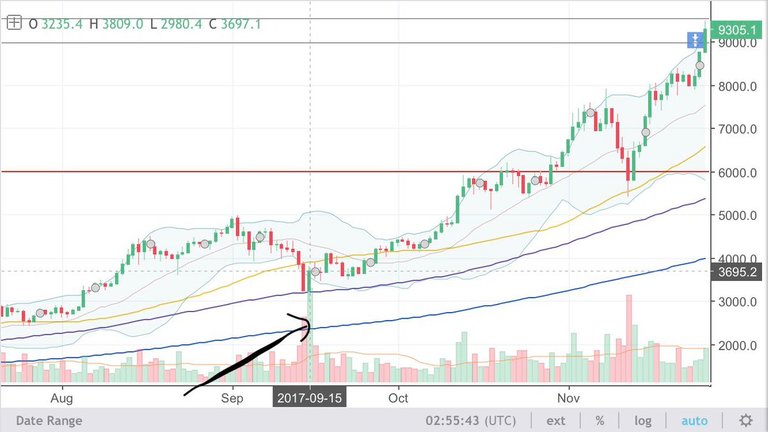
Here you can see the massive volume spike that occurred before we entered BTC's longest running and largest bull market. Now lets compare this to the volume required to pull us out of that massive downward spiral.
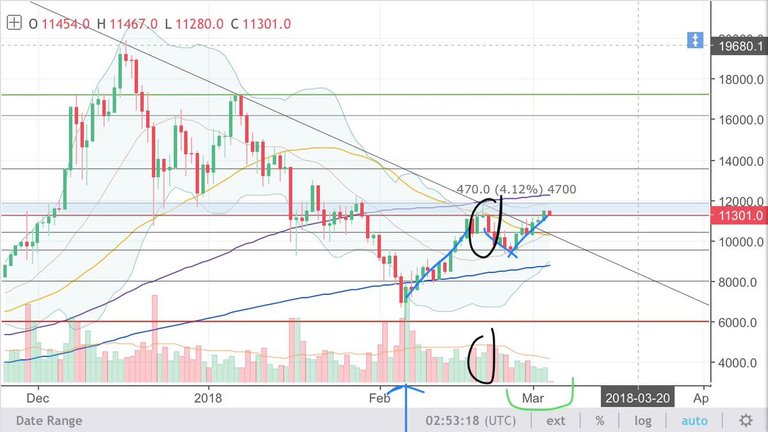
As you can see, the volume spike was MASSIVE. Compare this to the current volume. See the difference? This volume is barely half of what we had at the previous top where we tested $11.4k or so. Claiming that this small amount of volume is enough to break us through the strongest resistance level in this range is pretty ridiculous. Is it possible? I mean sure it is, but it would be a total fluke.
Let's talk market cap
Technical analysis and charts aside, one of the most important piece of this puzzle can be found in the market cap. Let's go back to February 19 of this year. This was the last time we tested the $11,400-$11,800 resistance zone.
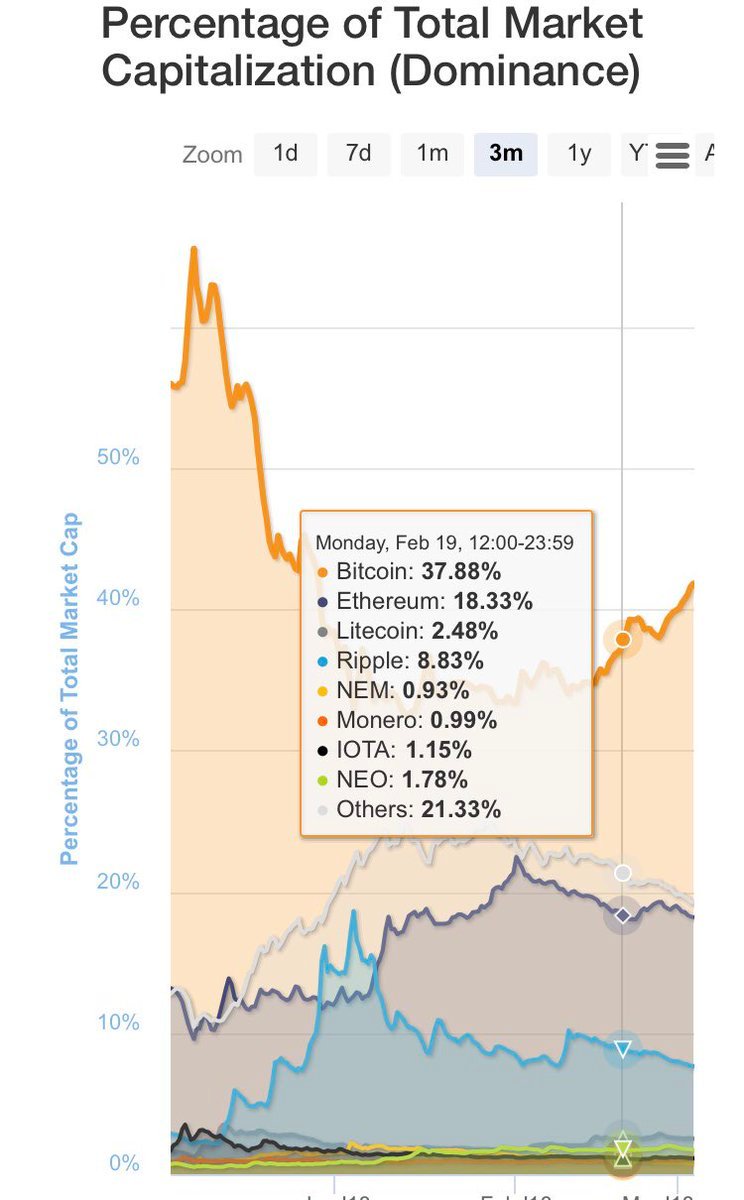
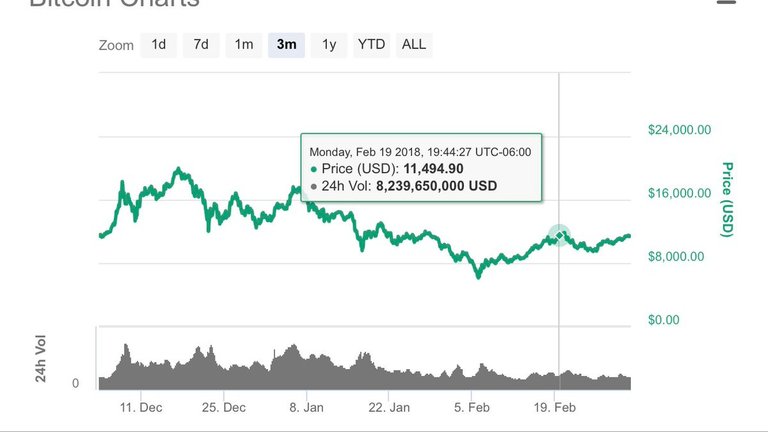
Bitcoin was at 37% market cap during this time period and trading at over $11,400. We have already seen that the buy volume during this time was almost double what it is currently. So at 37% market cap, we managed to reach $11,400 with some decent volume. We failed to break above $11.8k and hold it as a support level. We corrected back down to the $9k zone of resistance/support. We are now trending back up weaker than before. The most important thing to take note of is that a few days ago a MASSIVE alt coin selloff started. People don't appear to be taking money out of the market, but they have been selling into BTC. This is a sign of fear to some extent in the same way gold prices increase when people lose faith in the dollar and the economy--people move their money to a reserve to protect it. Another possible explanation is that people using TA heavily expected this move up to break through, so they sold alts into BTC. The final possible explanation is that new traders are just chasing the bull and buying higher and higher. It is likely due to all three.
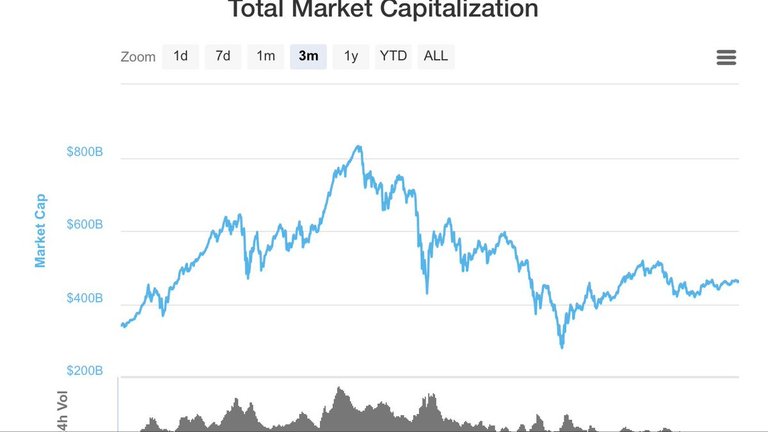
Another important thing to point out is that the total market cap on Feb 19 was over $500 billion. It is now $460 billion.
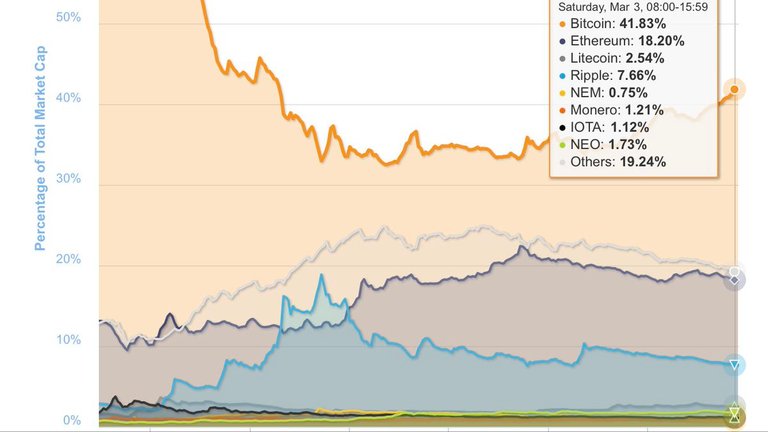
Now take a look at these market cap percentages compared to those from February 19. What is different? Well BTC has increased in market cap, yes? What else? Well all but ETH and Monero have lost a percentage of their market share. The rest of the market dropped from 21% down to 19%. Bitcoin "gained" 4% market share, but everything else lost market share. Combine this piece of the puzzle with the fact that volume is very low, massive sell offs have been occurring in ALT/BTC pairs, etc. and now you have a better picture of what is actually going on.
Let's make this easier to visualize:
Say you have a market with 3 coins. The total market cap is 16 a's:
| Coins | Value |
|---|---|
| SupaCoin | aaaaaaaa = 8 |
| ShitCoin | aaaaa = 5 |
| GunnaMewnCoin | aaa = 3 |
| Total Marketcap | 16 a's |
Now, let's say you're looking at charts and you see SupaCoin is going up in price. Sweet right?! Well maybe, but let's dig deeper and see what's going on. We flip over to the ShitCoin/SupaCoin market and we see that ShitCoin is crashing. Okay okay. Maybe its nothing. We then flip over to the GunnaMewnCoin/SupaCoin market and we see the same thing. What is going on here? Well it is pretty simple to figure out. When you flip back over to market capitalization chart, you see that SupaCoin has gained market share. The chart now looks like:
| Coins | Value |
|---|---|
| SupaCoin | aaaaaaaaaaaaaa = 14 |
| ShitCoin | aa = 2 |
| GunnaMewnCoin | a = 1 |
| Total Marketcap | 17 a's |
Your first impression may be, "OH MAN SUPACOIN GUNNA MEWN!", but look closer. Did the market actually grow? Well the Total Marketcap only increased by 1 a. This is definitely not much growth at all given that this market cap fluctuates 1a up or down very regularly. What actually happened was that money simply moved from one place to another. ShitCoin and GunnaMewnCoin lost some of their market cap to SupaCoin specifically on SupaCoin's trading pair. This means there was a sell-off of these two alt coins into the main reserve coin. In the chart, you can see the bold a's represent the a's taken from the other two coins. The "a" in italics represents a small injection of capital coming into SupaCoin likely from people FOMO-chasing the run up in price. Has there been overall market growth? No. Is this the beginnings of a bull market? No. Actually the market is weaker. If people are fleeing the alts into the reserve, this is a sign of fear. This is similar to how the price of gold skyrockets when people lose faith in the dollar or in the American economy.
So what would a bull market actually look like? This:
| Coins | Value |
|---|---|
| SupaCoin | aaaaaaaaaaaaa = 16 |
| ShitCoin | aaaaaaa = 7 |
| GunnaMewnCoin | aaaa = 4 |
| Total Marketcap | 27 a's |
or this:
| Coins | Value |
|---|---|
| SupaCoin | aaaaaaaaaaaaa = 16 |
| ShitCoin | aaaaa = 5 |
| GunnaMewnCoin | aaa = 3 |
| Total Marketcap | 24 a's |
Basically, the market cap must be growing before you can call something a bull run.
Another way to think about it: Say you and two other people have a pile of rocks each. You have 10 rocks, one guy has 5 rocks, and last guy has 3 rocks. You have 18 rocks total. If the first guy gives you 3 rocks, and the other gives you two rocks, you now have 15 rocks, but the total number of rocks has not changed. Someone dumping a bucked full of rocks on all three of you is a bull run.
In closing, stop fan girling and shitting your pants every time the market moves. Stop buying at the top and buying into bull traps. What happens is many traders will FUD DUMP the hell out of their holdings when the inevitable correction comes and do so at a loss. These dumps drive the price lower than it should go. We have enough trouble with price action due to all the market manipulation out there. Calm down.
As for when this will be a bullrun, well it's not going to happen until we break through this resistance zone and come back down to test it as support. Then we have a LONG way to go to get back to all time highs. Just hang in there.
—TheFeralTaint (CTOM Admin)
FACEBOOK: https://www.facebook.com/CTOMMod/
GROUP: https://www.facebook.com/groups/CTOM1
TELEGRAM: CTOM
TWITTER: @TheFerralTaint
Resteemed by @resteembot! Good Luck!
The resteem was paid by @greetbot
Curious? Read @resteembot's introduction post
Check out the great posts I already resteemed.
ResteemBot's Maker is Looking for Work.
You were lucky! Your post was selected for an upvote!

Read about that initiative
Hi, great post, have followed you. What do you think of the current state of the Bitcoin market?
The entire market is pretty weak. As to "what" is going to happen? I have no earthly idea. I just know that people who are screaming this is a bull market are quite frankly full of shit. There's no evidence that this is true other than random, unreliable TA strategies.
And thanks for the follow/like. I really appreciate it.
Hi. I am a bot that looks for newbies who write good content!
Your post passed all of my tests.
You get:
I also write bots and other code for crypto....