Everybody who buys, sells and trades cryptocurrency tries to predict when the highest and lowest price will be. The method I have been playing around with uses the vertex of a parabola to predict when the highs and lows will occur. In terms of math, the highs and lows are maximums and minimums. After I noticed that most price graphs take the shape of a parabola, I thought it would be fun to try to write equations and use those to predict the highs and lows. Here is a short guide on how I do it. I will first explain the concept and how apply it to crypto graphs. If it doesn’t make sense there is a very basic example of how to write an equation at the bottom.
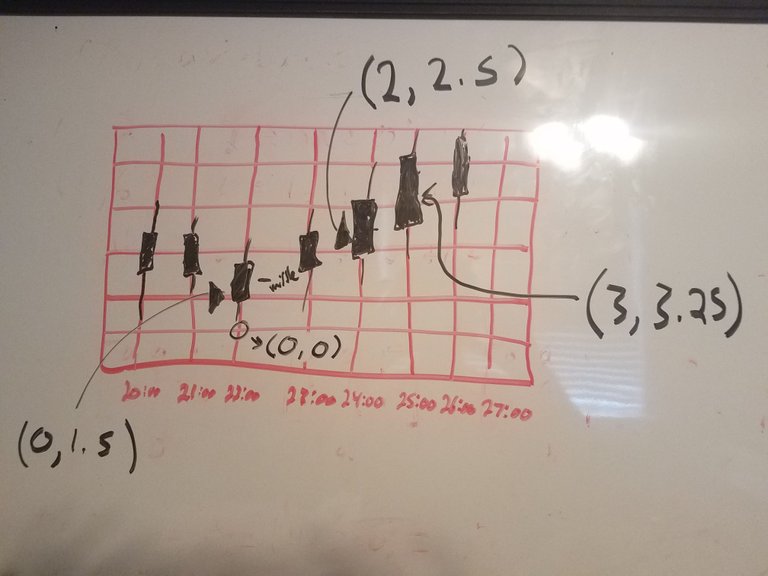
The first step is to get three points that are either progressively getting higher or lower. From these points, a quadratic equation in standard form can be made. The x-axis represents the time and the y-axis represents the price. To eliminate large numbers the first point can be made the y-intercept and the first intersection below that point made by the grid is the origin (0,0). Each line on the grid will represent one unit to keep the number small. The means the first point will be (0,Y). If the next point is two boxes over it is (2,Y) and so on. Since the charts have vertical columns, I use the middle so that there is only one x value. Here is an example:
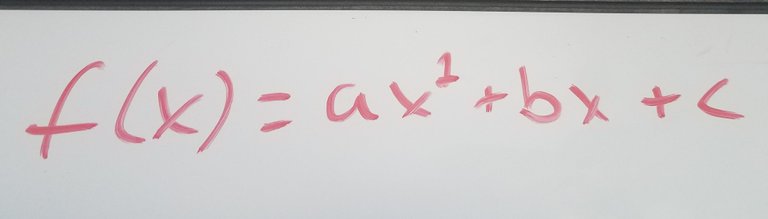
The next step is to make three equations with the three points by plugging in the x and y values into a quadratic in standard form, which is:
Ex. If the point is (2,3) the equation is 3=4a+2b+c
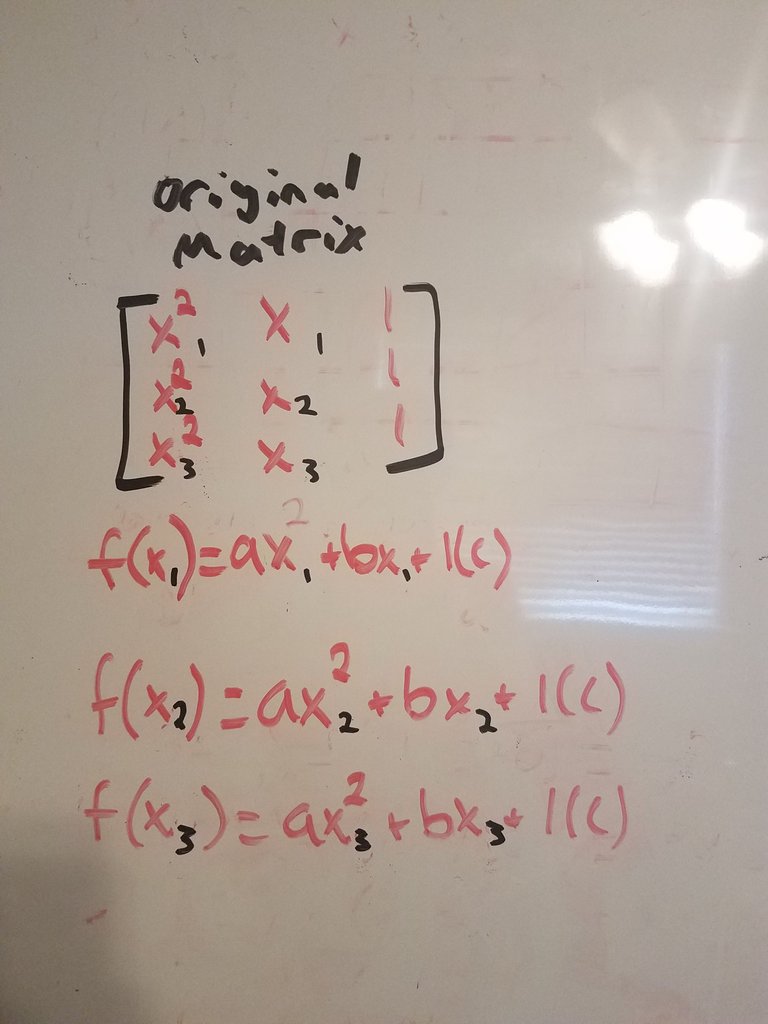
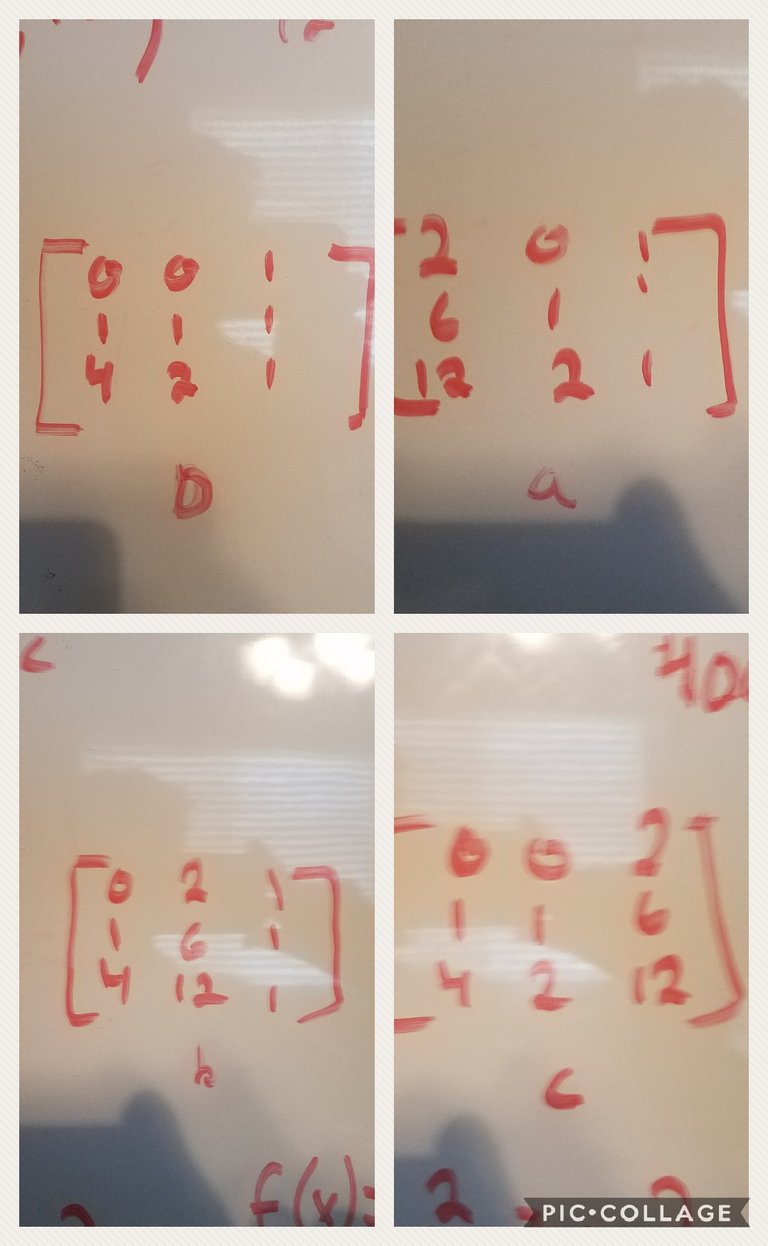
The following step is a little tricky and might make more sense if you view the example at the bottom. It involves making four 3x3 matrices and finding the determinant of each.
The first matrix will have the 3 a coefficient in the first column, the 3 b coefficients in the second column, and the third column will be all 1s since c is a constant.
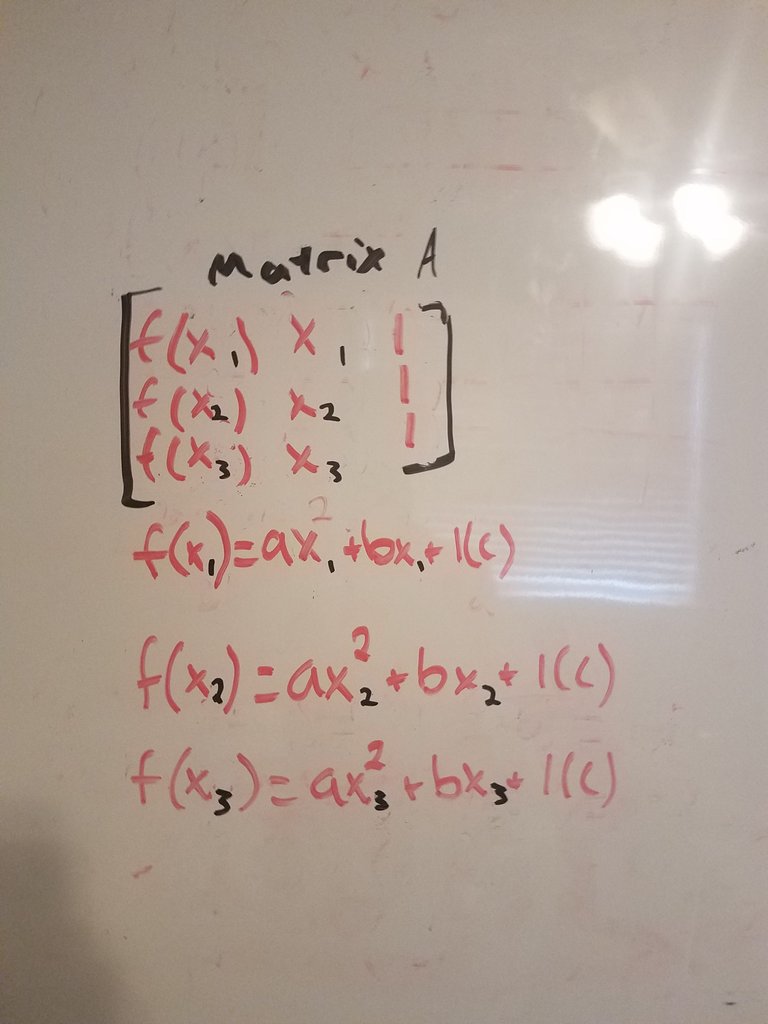
The next matrix, matrix A, has the three y values in the first column and the same second and third column as the original.
The third, matrix B has the same first and third columns as the original but the second column is the y values.

The fourth matrix, matrix C, has the same first and second columns as the original and the third column is the y-values
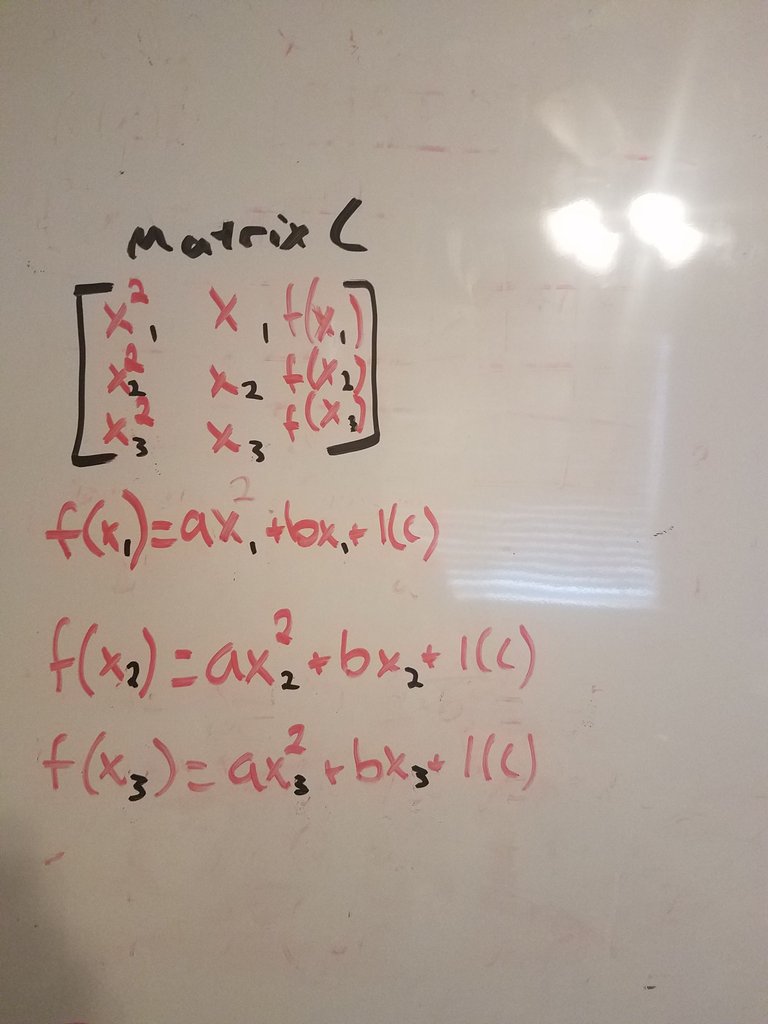
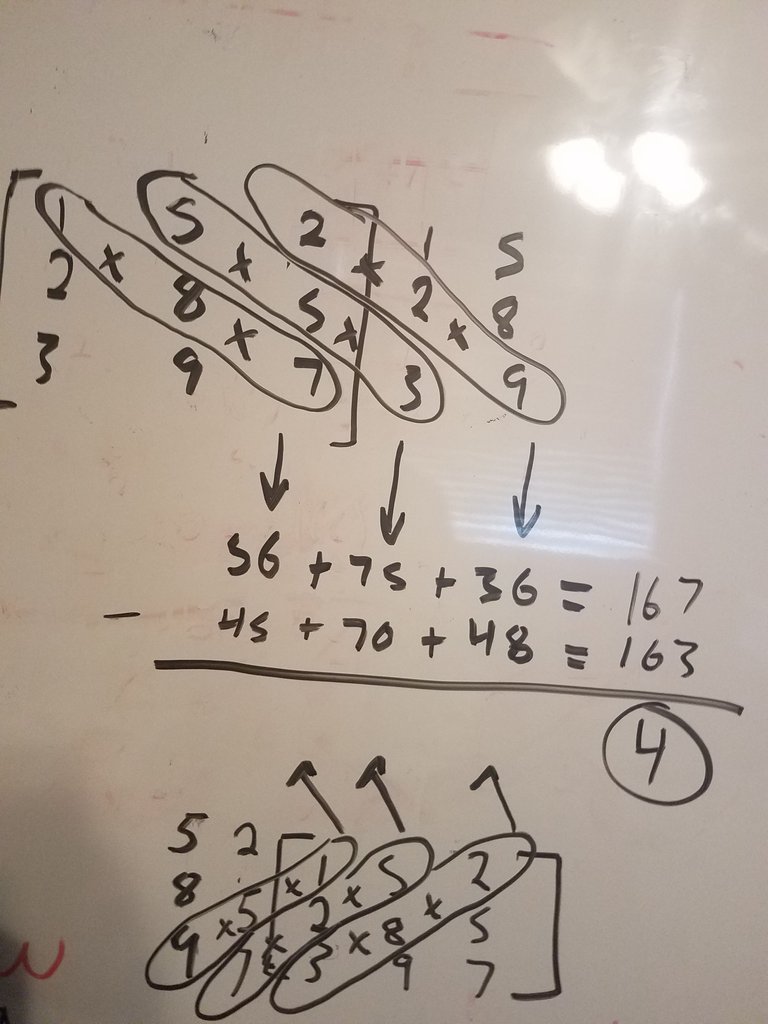
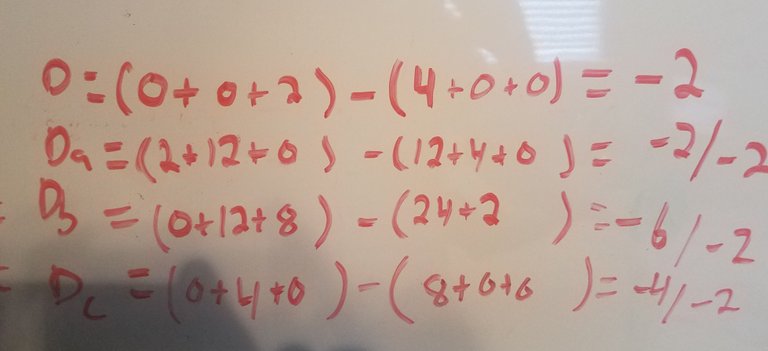
The next step is the find the determinant of each matrix, then divide the determinant of matrix A, B, and C by the determinant of the original matrix. To find the determinant of a matrix you must find the product of each diagonal then add the product together. It is easier to visualize the diagonals if you write the first two columns next to the matrix. You then do the same thing the perpendicular diagonals and subtract that number from the sum of the opposite diagonals (example below).
You can now write your equation. The determinant of matrix A divided by the determinant of the original matrix becomes your a value in the equation. The same is done for matrix B and C. This can be confusing, so I have a picture of the exact step in the bottom example. Once you have your equation you can find the axis of symmetry, which is the x value of the vertex. To do this use the equation x=-b/2a. Here's an example:
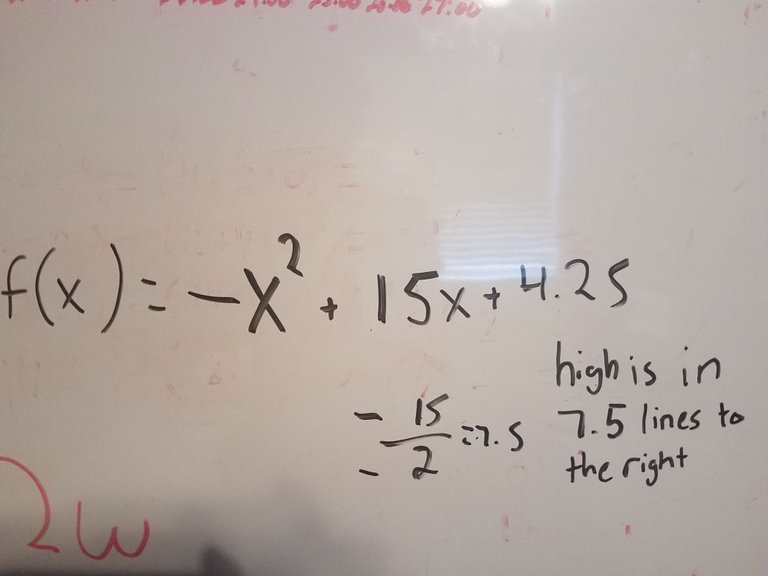
This is all you need to predict when the highs and lows will be, but you can plug the value of the line of symmetry into the equation to get the y-value of the vertex if you choose to. The value you get for your axis of symmetry will not be a time but a number of units. Starting from the origin you determine early, count x units the left and look down at the time given on the graph. For example, if your axis of symmetry was x=2.5, then count 2.5 lines over. You have now successfully predicted when the high or low price will be. If you are not familiar with quadratics, a negative a value means you have predicted a high and a positive value a low.
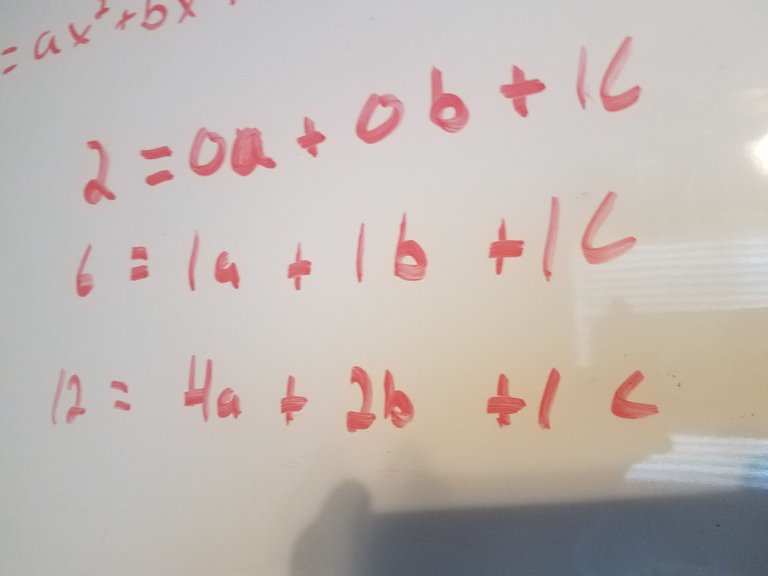
Here is a simple example of writing an equation. The three points from a graph are:

Now I plug them in to the equation:
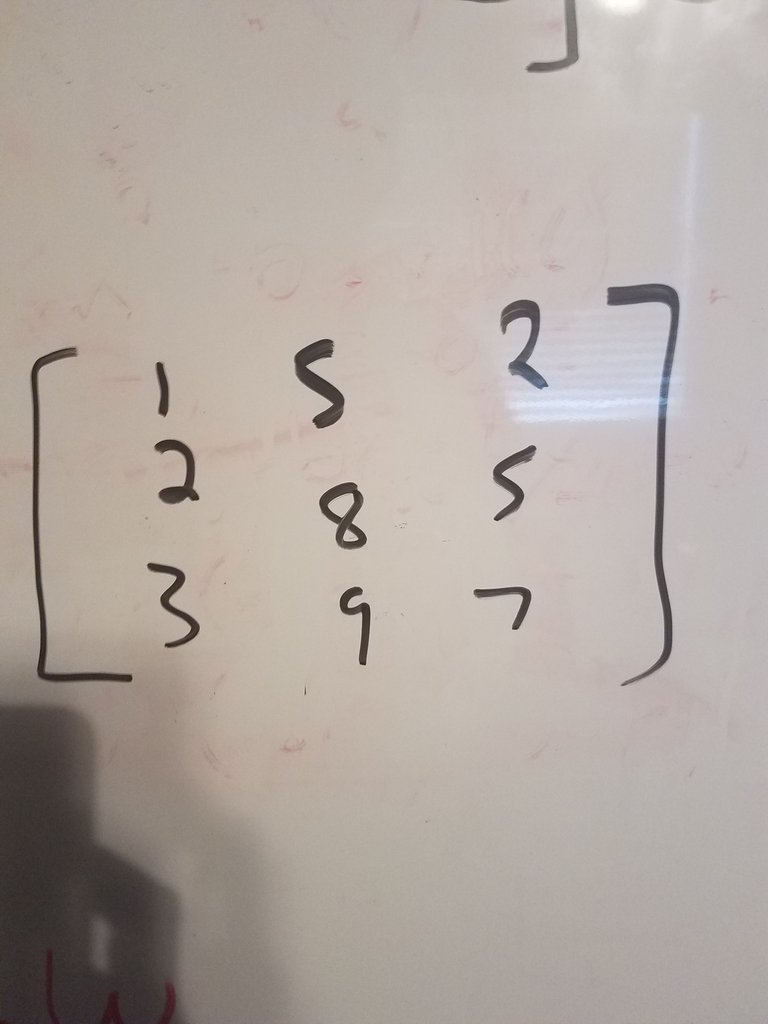
The next step is to make the matrices:
Now I get the determinant of the matrix:
Finally, I write the equation:

This is an interesting method to predict the highs and lows of cryptocurrencies. Although this can't predict large pumps or dumps, I have had success in small fluctuations. For example, a few weeks ago I was able to predict the time of the daily high of ethereum accurately (within ten minutes of the actual high) hours before it happened. It is very fun to try to predict the prices even if you aren't planning on investing. I encourage you to try it out and see if it works for you.
Interesting formula. I'll test it out, see how well it works. I've been seeing lots of fluctuation in prices as well.
Congratulations @jakejakejake! You have completed some achievement on Steemit and have been rewarded with new badge(s) :
Click on any badge to view your own Board of Honor on SteemitBoard.
For more information about SteemitBoard, click here
If you no longer want to receive notifications, reply to this comment with the word
STOP