(image from newsbtc.com)
As the master, himself, Warren Buffet has said of wise investing:
"Be fearful when others are greedy and greedy when others are fearful."
Does this mean that we should simply buy in the middle of a market slaughter? People are typically fearful when markets drop by over 10% overnight, right? So is that good enough reason to buy? Should we buy bitcoin now that it has dropped over 30% in the last four days?
Well, first of all, it depends on whether you're bullish on bitcoin's long-term potential. If not, you shouldn't be anywhere near it, unless you plan to play it as a "lotto" (play), in which case you'd be foolish to invest anymore than you would into a pile of lotto tickets. Secondly, it depends on your investment plan. For a scaling approach (buying in small lots or percentages of the total planned position with the plan to buy similar positions at future time increments or price levels), buying on a "big dip" might be effective and prove profitable in the long-run.
However, if you're planning on dropping a "boat-load" onto BTC, it would be better to wait for signs of a new market bottom (such as indicated by the "golden cross" of the 50 and 200 simple moving averages for the 1-hour candlestick time-frame and above) or to enter after a bullish pattern breakout or within a "potential (bullish) reversal zone" with logical stop-losses in place, just in case the market doesn't turn as we had hoped.
When the Market is Falling Apart from the Seams, Profit is Most Often Made at Confluence Zones and Potential Reversal Zones (PRZ):
Confluence Zones:
Many technical-analysis chartists/ traders have a list of trade patterns that they look for and/or statistical tools to measure price movements which help them decide when and where the market might turn in their favor. Almost all traders and analysts have at least a rudimentary grasp of traditional support and resistance levels, trend-lines, and moving averages.
In my opinion, the best, most consistent and profitable traders, have a grasp on all of the above and use them together to find price zones where two or more of the indicators for reversal are in agreement. A confluence zone is any price level on a chart that has two or more indications of reversal within a relatively tight price range (zone). The idea is that the the buying pressure (in the case of a price correction within a bull market) should be higher, the more TA indicators that signal a price turn.
Why? Because well over half of the market participants are using one or more of the TA analysis methods to determine where and when to enter the market. If more than half of those methods are in agreement that it's time to buy, then many buy orders are likely to come in at that level. The more TA indicators that signal it's time to buy, the more buy orders we should expect to come. Hence, these are very logical price levels to buy.
Potential Reversal Zones (PRZ):
Many relatively newly discovered chart patterns such as those used in "harmonic trading" have what are called "potential reversal zones" (PRZ), which are small prize ranges that have a relatively high probability of "capturing" the reversal price (into a new bullish impulse move) and are determined by price completing a strict ratio pattern of price swings relative to earlier price swings. The below image offers a glimpse into common harmonic patterns (image borrowed from c.mql5.com).
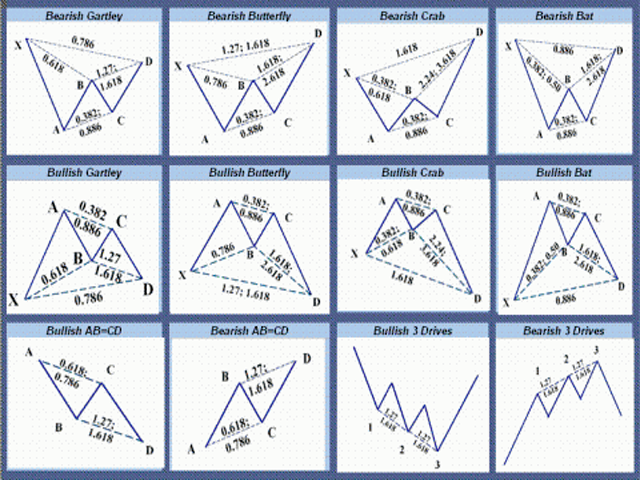
You can read more about harmonic patterns here.
You can view my personal harmonic patterns "cheat sheet" here.
Logical Stop-Loss:
Since no trade/ investment entry plan is bulletproof, it's wise to either:
1.) never put in more than you feel comfortable losing, should the trading instrument fall all the way to zero.
2.) set up an automatic "cut losses" price (stop-loss) at a price-level that's only likely to be hit if all your indications of a continued bull-market are incorrect and at which you'll take a loss that's acceptable to you.
Often times when I invest I'll settle on option #1, but I ALWAYS go with #2 when I'm trading (have a target price in mind to take profits). That being said, there's nothing wrong with planning to hold a position for the long-term AND having a stop-loss. In fact, that's probably the wiser decision for most people's financial circumstances.
Where to put the stop-loss is probably the most difficult decision for most traders when it comes to planning out and/ or executing their trade., I know it is for me. As with our entry price, it's ideal to have a confluence of support(s) between the price that we enter the trade/ investment and the stop-loss.
A good place to start is by having one or two horizontal support (zones) between entry price and stop. It's even better if we can get a trend-line between the two and better yet if we can have other types of support like significant Fibonacci retracement levels and major moving averages like the 50, 100, and 200 simple moving averages.
Keeping that in mind, we can't forget about how much we're risking to lose by settling on the stop-loss price. While it's true that our stop-loss has less of a chance to be hit if we put it well below our entry price it also comes with a bigger loss versus keeping it "tighter" to entry.
Putting it All Together...
CHART 1: 1-Hour Candlesticks of BTC/USD (Coinbase), Harmonic Pattern Outlook:

https://www.tradingview.com/x/fVxewqHr/ (click for bigger image)
CHART 2: 4-Hour Candlesticks of BTC/USD (Coinbase), Support Line(s)/ Trend-Line(s) (Bullish Bat pattern still highlighted):

https://www.tradingview.com/x/l57uOy1U/
CHART 3: 24-Hour Candlesticks of BTC/USD (Coinbase), Moving Averages/ Trend Lines:

https://www.tradingview.com/x/vqPahfWd/
... We Build Our Case for or Against Taking a Position -- Chart Analysis Time!
Just in case you haven't already noticed, each chart builds on the one above it (chart 1 to 2 and 2 to 3).
The first chart shows a simple harmonic pattern, called the bullish bat (BB) pattern. On the chart I lay out the traditional entry price (about $2,027, although I'd personally shoot for an even $2,000.00 entry for a better reward to risk on the position), stop-loss price (about $1,900.00, although we could make a much "looser" stop in the case that we're targeting an adequately high price to give better than a 1:1 reward to risk or are entering as a long-term investment), and the two target prices for this pattern (around $2,398 and $2,628).
If looking to purely trade bitcoin, seeing this pattern alone could be enough to take a shot at it.
Moving on to chart 2, I highlight significant support zones (areas where price has shown strong buying/ selling pressure in the past) in light orange and a confluence zone (with a significant level of the Fibonacci retracement tool that I drew onto the chart, specifically the 50% retracement level of the price swing) in green. We also see a trend-line (thick black line) and two moving averages: 50 (red) and 200 (pink) simple moving averages.
This extra information gives us a better idea of how strong of support we should find from buyers below the first buying opportunity (BB entry price) and where better (lower risk) entry levels are located. Because the first real confluence zone (green rectangle) is between about $1,880 and $1,950, it's both a logical price range to consider taking a long entry and also a logical price zone to place a stop-loss below, in the case that we take the BB trade.
Taking chart 3 into consideration, we see that the price has just tested the 50 (red) daily simple moving average (DSMA) and that the 200 DSMA (pink) is a good distance below the price.
Knowing that these longer time-frame moving averages tend to have a "momentum" or "pulling effect" to them could help build the case that entry between $1,880 and $2,000 are solid choices, seeing as price would have to dip a bit below the 50 DSMA in order to reach those levels.
However, seeing the good distance between the current price and the 200 DSMA is a little disconcerting for traders/ investors like me who like to have the support of the long-term moving average. Markets have a tendency to only trade so far away from this moving average before stalling and migrating back to it for a "test". This could signal to some to either avoid taking a position altogether or to size-down on the amount of money (size of position) that they're willing to risk on it.
Don't Forget the Fundamentals!
The more information that we have, the more informed of a decision that we can make. While my larger focus goes to seeing market patterns and trading human psychology, I always try to have some grasp of what's driving it all in the "real world".
Coming up in early August, we could see bitcoin hard-fork into two different block-chains. With this as a possibility, many market participants may decide to stay away from bitcoin as an investment, which could lead to these usually dependable technical-analysis indicators having lesser influence on individual trading decisions.
One saying that I heard early in my trading career, which I wholeheartedly agree with is:
"Big news/ announcements trump technical-analysis forecasts."
In the case of bitcoin (with respect to the potential hard-fork in August), a lot, if not most, of the market will likely be uncertain about what to expect and that usually doesn't bode well for the bullish-camp.
Even for those with strong bullish biases, who believe that bitcoin will come out stronger on the other side of the upcoming soft-fork and potential hard-fork, it still might be wise to target the lower risk long-entry signals, such as on the low end of the confluence zone (around $1,880, although I might target a bit lower at around $1,850 to $1,800).
I agree with your assessment. I was looking at 2000 for a turnaround or at least a stopping point for the decline. I was also looking at 1850, so we're on the same page here. The 2000 thing has pretty much already happened. I guess we'll see if it's pushed lower and whether that next stopping point is correct.
There must be something to this charting and analysis stuff. Some people call it "snake oil" and "bullshit." I call it, "the ability to read the context of markets and the ability to identify patterns." Not everyone understands how to do that, apparently. But it's certainly not mysterious.
Yeah, I'm already ignoring the $2,000.00 level as a long for the reasons stated above. $1,800 to 1,850 still looks attractive to me. I might even throw a bid in around $1,620 ~ 1,650, since it had a lot of pivots around that area AND the 200 DSMA is likely to be close by for added support by the time price would reach there.
As to technical-analysis and whether it's legit...well, I've made a lot of money off of trusting what I read about certain patterns and trading patterns that I notice, so either there's something to it or I've been really lucky up until this point. Either way, I'm happy :)
One thing that is indisputable though. During the selloff from teh pre-Memorial Day high pretty much every bitcoin technical analyst was looking at the 1850 to 1800 area as the "buy the pullback!" price. The low for that particular move was only $1880 tho. So none of those guys have the right to say they called the turnaround that led to this rally. :-) Now I'm sure everybody will be saying the exact same thing you are, that $1800 to $1850 will be a good "buy the pullback!" re-entry point. I have a "suspicion" we will find out reeeal soon how many of them actually follow their own advice. Technical analysis becomes technical anal-ysis if it doesn't work. Doesn't it? :-)
Well, I know I'll be buying there, as I already have the bid set up through my broker.
That said, I'm not going to throw my whole wad at it, cuz I wouldn't be the least bit surprised if price fell through that "wall" like a hot knife through butter, especially if a bitcoin hard-fork happens around that time.
As it stands, I have bids through the 1800's, 1600's and 1200's and I don't plan to go back and fidget with any of them. I DON'T have stops in place on any of those trades, btw.
I'm still in profit on all of my original bitcoin position, most of which I bought when it was ranging between $200 and $350. My highest buy was at $2200, but that was for only 1 BTC. My next lowest buy to date was at $1600 for something like 3 BTC. After that, I don't think I have a buy above $750. I longed over 30 BTC from the $200 ~ 350 buys (first sell came in above $750), just to give you an idea of where I am in terms of overall profit.
Imo, every single one of your buy points will be taken out with lower prices over time as China begins to implode and gives up on manipulating bitcoin prices and moves to the "safety" of the U.S. dollar and govmint debt assets. You do realize that it is likely China that is manipulating the price of bitcoin at least...I hope. :-)
Maybe. Or maybe they'll never get executed because price explodes from here.
Manipulation occurs everywhere that the human hand touches, so, yes, I do realize that. Manipulation isn't a problem for me, I just want to profit with the manipulators!
I don't pretend to know where bitcoin is going in the short or long-term, but I know what's worked for me in the past and that's what I base my decisions from. If I'm wrong, I'll take losses on these small positions but I'll still pull a nice profit overall, since I'm riding on free bitcoin -- 26.5 free bitcoin, to be exact :)
All this being said, I would likely play this situation the same, with or without a prior, very profitable position, I'd probably just go a little lighter on what I buy and wait for signs of confirmation (of new uptrend) before I'd consider adding to that position.
I hope it remains bullish! :)
Me too, bro.
It looks good so far, with it getting a nice big bounce off of the 50 daily simple moving average -- definitely a good sign.
I hope so too. Otherwise it will be very insulting :)
Awesome blog buddy Big thanks and yeah I'm holding mine for sure.
Smart move, my man!
Thanks buddy :) I think in a few months todays prices will look a bargain.
You're welcome :)
I think so too.
I have yet to be convinced that these chart analyses are not just mumbo-jumbo... I mean, what are they actually based on after all?
Human psychology, which is somewhat predictable... easier to predict than heads or tails for a coin, at least.
hmmm.. you're a trader?
yes - if.... we are on it for a long term investment and the predictions about it will really push through
it looks like the wind is staring to blow in a different direction - eth?
My crypto strategy is typically buy and hold half of the initial position(s) and trade the other half. With bitcoin it's been more of a buy and hold 70% and trade the other 30% and I'm starting to treat ETH the same way because I think you might be right about it "taking over".
My plan to weather this battle between cryptos is to spread out my bets across the top coins, with the majority of it going to the current leading coins like bitcoin, ether, ripple, litecoin, etc.
Obviously, I have a pretty decent bet on Steem, too, and I still think that it has the best chance of paying me off big, both short-term and long-term.
Hum... okay but who guarantees that people always follow those patterns?
There is no guarantee, it's statistics and probability.
Exactly!
Thanks for taking what I was trying to say and putting it succinctly :)
There are T/A tools that measure noting but investor sentiment, such as OBV, DMI, and RSI readings. The best way to "know" what people/sheeple/skeeerdy cats will do next is to look at exactly what they are thinking at any given time. I don't use volume statistics or moving averages at all in my chart analysis because they are worthless indicators imo. Price is the most important, and "knowing" which price highs/lows need to be breached is the "bible" of being a successful trader. If you asked the ave technical analyst where the closest major support area is on the stock they were trading, 90% of them would have no idea. :-) But yes, there are guarantees. For bitcoin, the technicals on bitcoin tracker GBTC already told you that yesterday's 297 low will get taken out. And "actual" bitcoin will follow the path of GBTC (not the other way around), therefore, bitcoin is "guaranteed" to breach yesterday's $2134 low. Let's watch and see if it happens over the weekend.
http://bigcharts.marketwatch.com/advchart/frames/frames.asp?show=&insttype=Stock&symb=gbtc&x=48&y=20&time=3&startdate=1%2F4%2F1999&enddate=6%2F12%2F2017&freq=7&compidx=aaaaa%3A0&comptemptext=&comp=none&ma=0&maval=9&uf=0&lf=1024&lf2=2&lf3=8&type=2&style=320&size=4&timeFrameToggle=false&compareToToggle=false&indicatorsToggle=false&chartStyleToggle=false&state=11
You can pull this live bitcoin ticker chart back to the 3 day window if it goes to the one hour default. That will show you the low that is definitely going to be taken out in short order.
http://bitcointicker.co
No guarantees.
It's like closely observing a relative and how they emotionally react to certain situations. No matter how much time you put into observing them and taking note of how they react, you can't ever be 100% sure how they'll react in a similar situation in the future, but you'll probably be right more often than wrong.
In the same way, collections of traders and investors usually react in the same way that they have in the past to similar market conditions. Not always, but more than 50% of the time, which is good enough to make profits from.
Nice post.
I'd be curious if there is a financial comparison to a 'Hard-Fork'.
A company breaking up? Selling off a piece?
How do markets normally react in those scenarios? Doubling down on the valuable piece while abandoning the perceived weaker piece?
Anything that brings a large amount of uncertainty with it in the markets would be a good point to start with. The replacement of a long tenured CEO for a fairly established company comes to mind as somewhat comparable.
More often than not, this would lead to a bearish outlook short-term, but can often lead to more growth in the future. A lot of the market in these type of situations will either lighten positions or sideline themselves to gauge market reaction to the event(s). However, it's the whales of market that really determine where it goes and who knows how they're going to treat this or how much, if any, inside information that they're working with.
The big players might have already loaded up for a push beyond $3,000.00. Time will tell.
Great analysis, thanks for putting it together. I'm watching keenly to see where things go from here.
Thanks :)
This post received a 46% upvote from @randowhale thanks to @jamesbrown! For more information, click here!
@tim-beck, of interest
I'm not sure what you mean. Do you mind elaborating a bit?
It was an excellent post I wanted to make sure my fellow Steemian had a chance to catch. Easy to miss good content here!
I appreciate it. I completely agree that a lot of good content can go by unnoticed. The recent growth of the Steemit community has made it a real chore to read through everything...but that's one NICE problem to have :)
Indeed! On we Steem!
I think she's just tagging him to read your post.
Exactly.
Oh, ok, that makes sense.
Nice profile, I FEEL GOOD also after reading this article :D
That's nice to hear :)
Bitcoin...a "lotto play"??? As it trades at $2500...up 1000% in less than 2 years? People buy lotto tickets for the "thrill" of making a small bet that pays off HUGE! Bitcoin is a lotto play that already paid out the entire prize pool imo. So it is anything but a "lotto play" at this point. :-)
Set a stop loss? Have you been watching the daily swings lately? Where are you going to set your stop to be confident that it "might not" get hit? :-)
Next move will likely be doooown and take out ALL the stops. I just re-entered GBTC short today and yesterday after banking a 12% gain in less than 10 trading days. I started trading it with a "mythical" $1000 starting account value. I'll be "shocked!" if I haven't doubled the account value in a week or 2. Sentiment is very easy to figure out using the U.S. exchange traded bitcoin tracker GBTC. No trades at all in my bitcoin daytrade model for over 2 weeks as GBTC has not even come close to generating a short term buy signal yet. It'll be fun to see what the "highly followed" bitcoin advocates are saying after this next wave of selling coming here soon. I figgered it was going to start today. Not sure if you noticed how bitcoin sold off as the Silly Con Valley stocks like FB, AMZN, PCLN, TSLA, GOOGL, NFLX etc went into their swoon, and then rebounded as those plays all had a brief rebound. My only funnymental take is that the money driving the cryptos will dry up as the Silly Con Valley bubble deflates. Future is very dismal for all cryptos as they will follow bitcoin in all likelihood. And the future has already been determined by the past of the bitcoin tracker GBTC. This goes aaaall the way back to its "starting point" eventually...taking 'actual" bitcoin with it.
http://bigcharts.marketwatch.com/advchart/frames/frames.asp?show=&insttype=Stock&symb=gbtc&x=52&y=12&time=10&startdate=1%2F4%2F1999&enddate=6%2F12%2F2017&freq=1&compidx=aaaaa%3A0&comptemptext=&comp=none&ma=0&maval=9&uf=0&lf=1024&lf2=2&lf3=8&type=2&style=320&size=4&timeFrameToggle=false&compareToToggle=false&indicatorsToggle=false&chartStyleToggle=false&state=11
I realize the "lotto" comment sounds a bit ridiculous considering where bitcoin is trading relative to where it has been, but there has been some talk of bitcoin's market cap potentially exceeding $1 trillion and beyond (for over a 24X move from these levels) looking out over the next 5 ~ 15 years, which is good enough in my books to call it a lotto-play.
I've actually made most of my money by simply investing a fraction of 1 BTC in "start-up" cryptos. Fast forward one year and I'm pulling out full bitcoins in profit and keeping half of my original "investment" -- that, to me, is "lotto earnings".
I appreciate the work that goes into making these charts. But good technical trading would also establish how frequently these patterns worked for the asset in the past. Have you had a chance to do that? Even a glance at the data immediately preceding your identified "Bullish Bat" sure look like they would have been gored, and repeatedly. The more volatile the asset, the harder it is to have any reliable pattern.
Why draw a hypotenuse from point X to A on the first chart and not draw it to the June 5/6 high? The human mind has a tendency to find false patterns in nature, and this compendium of patterns seems non-falsifiable.
If I say I see the "Engorged Pelican" formation (belly from May 25 to June 5, beak 5 to 12, and fish dangling from its mouth just after that), how would that be proved or disproved anymore than the "Bullish Bat"?
Hahaha...
I know where you're coming from about the patterns and subjectivity around them. I really do. BUT, in my experience some of them work more than enough to be profitable trading them and there are a number of traders who have logged in years of trading them and "back-testing" them, who have demonstrated an over 50% success rate on these patterns, which is more than good enough to make profit when the targets are over 2 times the risk.
I've done some back-testing myself, but, quite frankly, I don't have the time to put into back-testing individual trading vehicles for these patterns and, thankfully, I don't have to because I never trade based solely on a pattern or pattern breakout.
I trade based on "case evidence", based on the gamut of technical analysis indicators/ signals. IMO, a simple "bat pattern" isn't reason enough to enter a trade. However, if that pattern completes at a major support level AND has the support of the 50 DSMA, well, then I'm watering at the mouth to jump on that opportunity.
I can't say this is an instance of the bullish bat being successful, because it didn't quite reach point D, but I've seen it be successful enough to take it seriously and to take it into consideration when I'm trying to build my case for or against a trade.
I appreciate the thoughtful response. To be clear I believe technical patterns are possible in immature and small markets - and cryptocurrencies are among them. Back in the (2014) day there was an MIT Paper no less that showed extraordinary gains albeit with a very small unit size. Good luck with your trades thanks for sharing.
very good article..
Thanks, bro!
For me @jamesbrown the Crypto market is news-driven. So as soon as the BTC fiasco is over, all the markets would again go up together with BTC.
I am bullish for most coins.
Yeah, I'm bullish on the market overall, which is why I decided to split a good portion of my funds across the top 30 cryptos. My version of the S&P 500 for the crypto market.
Whoah, 30 coins!
Remember me when you get to paradise. :)
Forget that. I'll bring you with me :)