
BTCUSD - Day Traders Chart Setup
Moving averages:
Green = 50dma
Red = 200dma
Orange = 9ema
Black = 20ema
The action is still in BTC and with the difficulty retargeting that happened miners have indeed switched from BCH back to BTC as the alt coin became 38% more difficult to mine and the price floundered.
Our previous analysis for price thresholds in Bitcoin were as follows:
Bullish Above: $6268
Bearish Below: $6000
I will continue to use the Day Traders set up when tracking this action to try and avoid false signals of longer term trends.

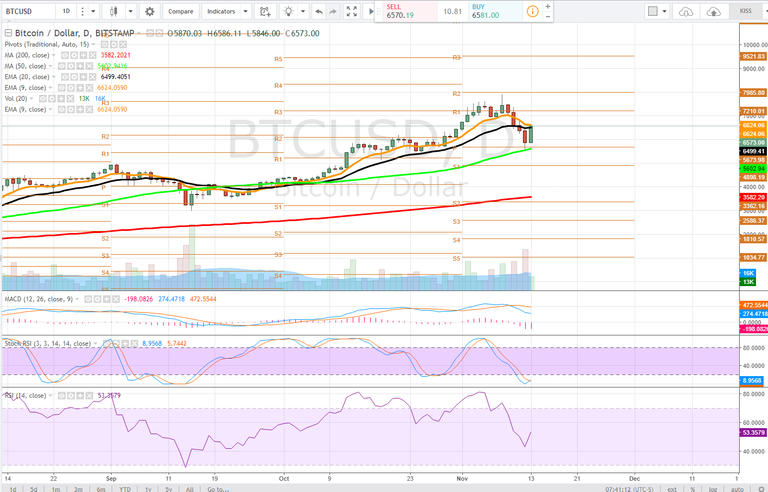
Daily
On the daily time frame as predicted the price hit $5500 which was the 50dma average and wicked sharply with a reversal candlestick following up the price action. The stochastic RSI has fully cycled into down trend and the MACD had a bearish cross though the divergence is relatively muted. This price action also corrected the RSI
Currently the price is testing the 9 and 20 ema and sooner or later traders should be looking for a dip to buy if they are not already in position. Longer term investors may look to add on any pullback here. The Price has managed to hold daily pivot support so far and we are looking for a test of the R1 pivot resistance approximately $7210
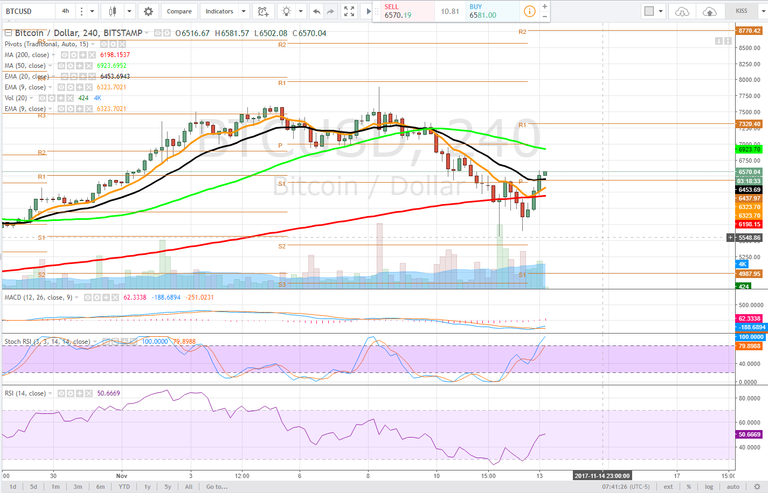
4 hour
On the 4 hour time frame the stochastic RSI is just reaching uptrend with the RSI bouncing from oversold. A double bottom in the RSI can be observed. The MACD just crossed bullish with the bounce from the lows. Price has reclaimed the pivot on this time frame, trading above the 9 and 20 ema. A possible opportunity to add would be any dip to the pivot on this time frame. Consolidation should be expected near term. Just the same price could extend as high as the 50dma on this time frame before we even enter consolidation, $6923.
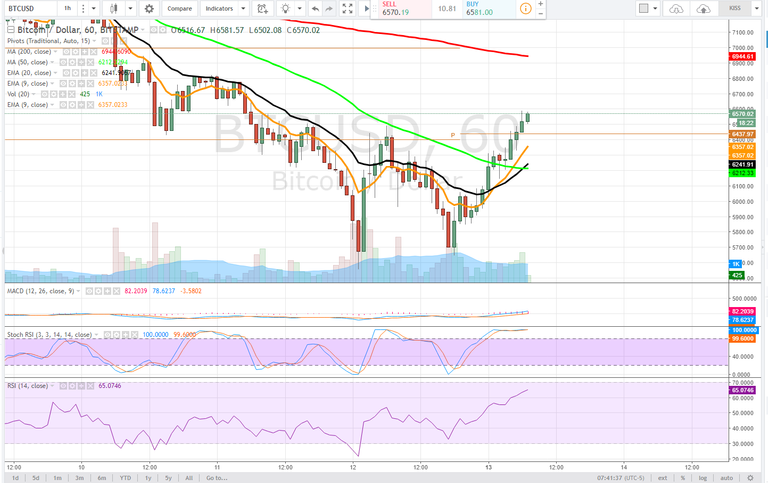
1 hour
On the 1 hour time frame we are looking at more extended price action, however the W bottom or double bottom is quite clear. Bullish moving average crosses of the 9 and 20 ema above the 50dma are a good sign. Risk averse should consider waiting for a consolidation period to add or take a position. Bulls need to see the pivot $6437 hold on any kind of pullback as the 9 and 20ema pull up to this level. First bullish target on the 1 hour from here is the 200dma $6914.
Just going to quickly show you the 15minute chart where we see a golden cross is underway, that is the 50dma crossing above the 200dma after a double bottom was established.
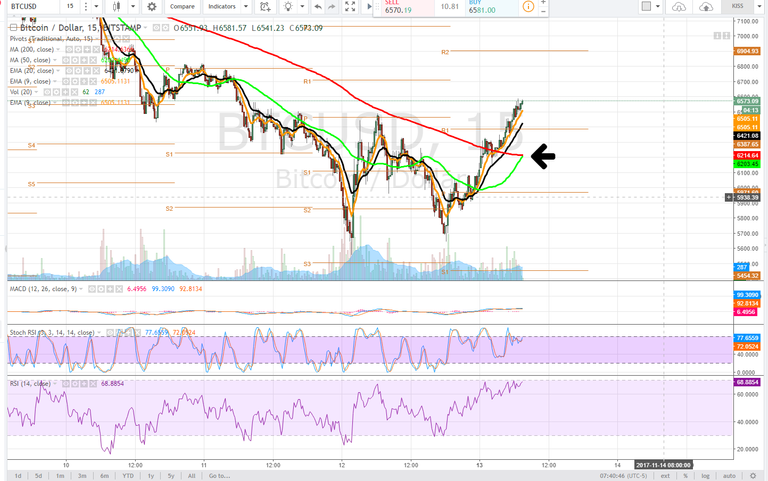
Our thresholds are wide at this point in dollar terms, however, in percentage terms we are talking about a 5% deviation.
Bullish Above: $6700
Bearish Below: $6200
RISK TRADE: Scale long here, adding all the way to the 20ema 1 hour time frame.
Don't forget to use stop losses!!!
Previous Articles:
BCHUSD
BTCUSD
ZECUSD
XRPUSD
ETHUSD
BTCUSD
BCHUSD
ZECUSD
LTCUSD
BTCUSD
Follow at your own risk, Not a financial adviser, understand the risks associated with trading and investing. Manage your own Risk - in other words you could lose it all and it's your own fault.

Glad you explained it to us, I think you are the only one who knows whats going on. Thanks for the update.
hahaha it takes a lot of study, but I am happy to share any information i can discern from the changing market dynamics. Happy Trading!
Your a Star
I love the detail and your analysis.This adds great content to the community each time you post!
Thanks I hope to help people learn to perform charting as much as provide trading setups.
Well, you're doing a splendid job!
dawww shucks
Thanks putting the effort into writing this.
Your previous article gave me the idea to simultaneously short BCH and Long BTC... glad I did that :)
Solid play! Very Nice!
Thanks,
It was a good couple of days, but now I'm back on the sidelines. Waiting for the confidence to make the next move :)
Hey whats your opinion on OKcash ..
hold the 6200 sats level and its a bull flag with 10k on deck. lose 6200 sats and retrace is underway.
Yes right
good information thanks for your sharing.
Great post like it @satchmo
Good information thanks
That's really great post man informative post :)
wow nice post I like it @technical.google
Can you do another post for other crypto-currencies also? And thanks for sharing :)
I do 1 per day usually, i don't want people to chase other coins or become overwhelmed with trying to get exposure to everything im playing. Right now focus on bitcoin because thats where the action lies.
I will do another analysis of steemit soon, and some alt coins.
That would be great :)
nice job on steemit
Great post. Thanks for sharing!
Hi, your post is very good I like, see is my introduction post @iqbaallsm
Right!
Interesting post.
Visit CoinCheckup.com | SteemIT - Daily Technical Analysis
Your detailed analysis inspired me to follow. Thanks