
BCHUSD
Bitcoin continues to break higher and surprisingly bitcoin cash followed it for a bit before pulling back.
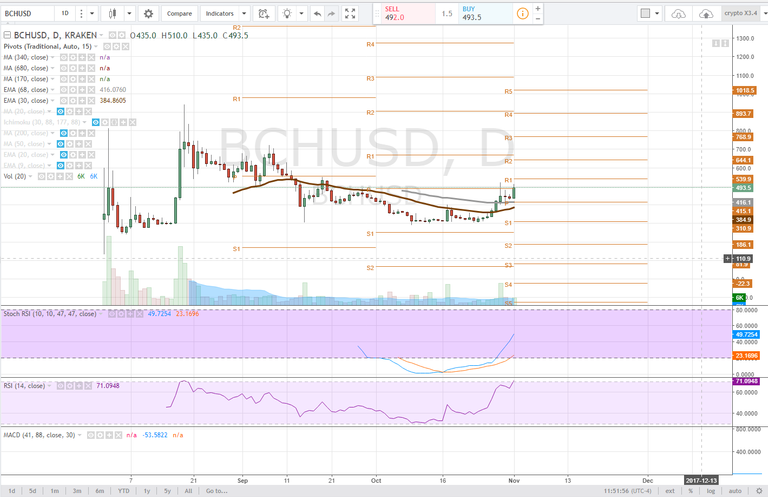
Daily
On the daily time frame we can see that BCH managed to reclaim the pivot after turn the 30ema and 68 ema into support. The curl in moving averages suggests a bullish cross is underway. It is important to remember moving averages are a backward-looking indicator and tend to lag price. They extremely important areas of support however.
The stochastic RSI has created a wide divergence as it curls out of the downtrend. The RSI is only just reaching overbought and there is not enough chart data to full fill the MACD. The formation on the chart appears to be a bull flag breakout and the next area of resistance we look to should be R1, $539.90.
If the price pulls back the key level to hold is the pivot, $415.
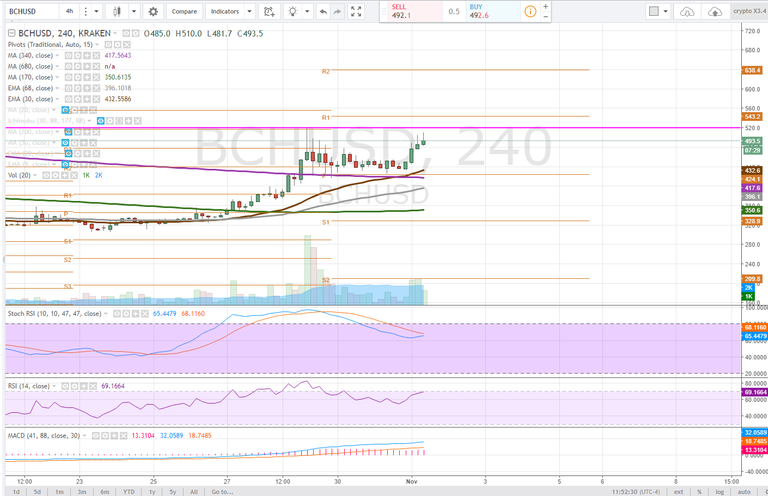
4 hour
The previous high is a critical area to break above, approximately $520. The stochastic RSI is possible to curl back upwards, as we are observing the shorter term moving averages pushing above longer, and a break above the previous high would give way to r1, $543.
The RSI is as well getting close to being in overbought status and while it's trending upwards over the longer term, in the short term it may start a shorter term downtrend. If the price pulls back the 30ema will be a key level to hold.
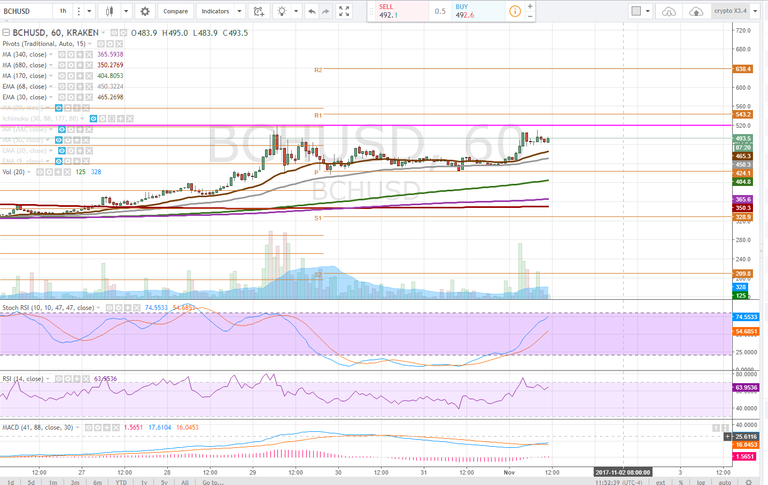
1 hour
The current shorter term formation has taken the appearance of a bull flag but in a longer-term sense, there is a risk of a double top forming. So it becomes imperative for the price to print higher and then hold this level on any pullback.
The stochastic RSI can push into full uptrend as the MACD had a bullish cross with the RSI to trend higher. Volume has also climaxed and since waned during the bull flag formation.
Key moving averages to hold would be the 30 and 68ema.
Bullish Above: $522
Bearish Below: $469
RISK TRADE: Buy on a breakout of the bull flag, use stops in case it's a fake out.
Don't forget to use stop losses!!!
Previous Articles:
ZECUSD
LTCUSD
BTCUSD
ETHUSD
BTCUSD
LTCUSD
XMRUSD
Follow at your own risk, Not a financial adviser, understand the risks associated with trading and investing. Manage your own Risk - in other words you could lose it all and it's your own fault.

the future of bitcoin is prominent and your future is similar, thanks for the analysis, it will help me to contrast it with another analysis that I have. it is satisfying to find people who do this work, the way you did in steemit.
I wish you many successes, I will continue looking for mine in steemit
Upvoted. I'll be resteeming this now :]
Bitcoin Cash has overtaken Ripple and keeps the trend!
great technical analysis thank u.
very informative, thanks for sharing! Need to know more about bitcoins
Great post! thanks for sharing.
Very good interesting post
informative post bro...
i also feel btc will increase more
Thanks for sharing the nice post @ satchmo
Great
bitcoin all new time high
Last trade: $8,900.11CADVolume: 627.23260580XɃTLow: $8,900.00CADHigh: $9,240.00CAD
very informative, thanks for sharing! Need to know more about bitcoins