
The biggest news in the last few days & couple weeks has been China’s ban on Bitcoin/Yuan trading and ICOs. Almost all the major Chinese exchanges have officially announced that they are ending Bitcoin/Yuan trading by either the end of September (BTCC) or October (Huobi/OKCoin). Yunbi and viaBTC have also made announcements. China’s ban is a significant setback for Bitcoin liquidity and adoption and has some potential to trigger a longer term bear market in Bitcoin and cryptocurrencies. However China’s once dominant market share and influence in Bitcoin trading markets have diminished this past year. Japan and South Korea each seem to now have just as much or more influence on Bitcoin trading in 2017. Hence it will be interesting to see how quickly Bitcoin can recover, and what other fundamental drivers may help Bitcoin and cryptocurrencies maintain its torrid momentum. Token sale activity and institutional investor interest seem to remain strong from my perspective. Furthermore Bitcoins will be available for institutions in the form of options and swaps this fall through LedgerX and that should bring massive amounts of institutional liquidity to Bitcoin. Will this be enough of a driver to continue this massive bull run since the beginning of the year?
Technical Analysis
Review: Support & Resistance
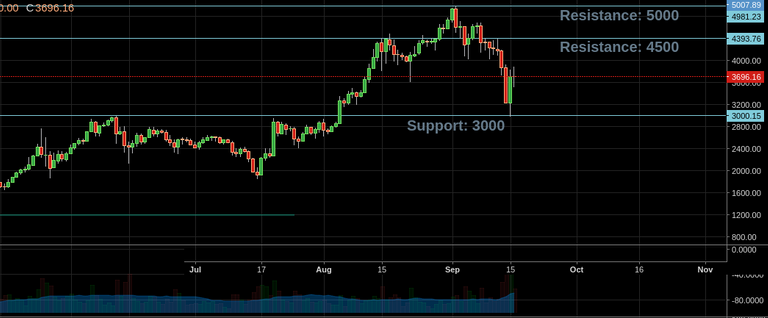
Here are some support and resistance level charts from the last few weeks in Bitcoin and Ethereum. We can see Bitcoin reached an all time high of about 5,000 before the China ban news sent prices below the 4,500 support level all the way down to the 3,000 support level we identified in our last post. There was recently a good bounce around 3,000 and now a channel between 3,000 and 4,500. Let’s see how long prices remain in this channel and when there will be any breakouts or breakdowns in the coming weeks.
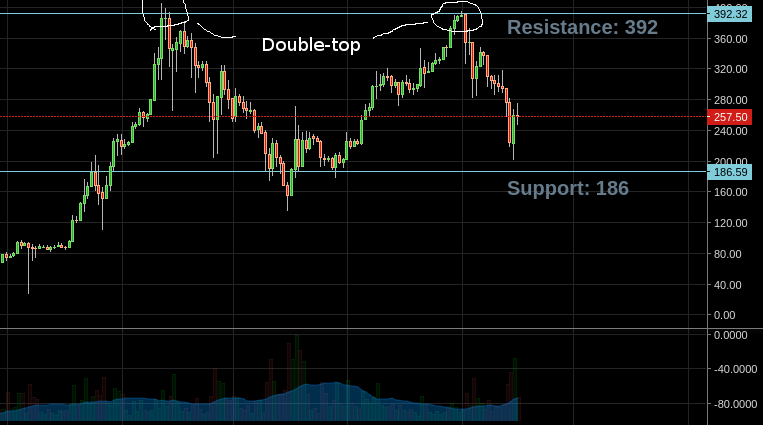
For Ethereum the momentum was stalled right at the all-time high resistance level to form a double top. Double tops are usually a bearish signal.
Technical Analysis: Moving Averages
In this week’s technical analysis post I’ll review some basics in moving average analysis. Moving average indicators can give traders a sense of how prices are trending. A simple moving average is the average of closing prices over some time span (eg. 10 days). To calculate it all you do is sum up the closing prices for the previous time span and divide it by the time span to get an average price.
Example:
Closing Prices last 5 days: 5, 6, 7, 8, 9
Sum of prices: 5 + 6 + 7 + 8 + 9 = 35
Time span: 5 days
Simple Moving Average (SMA) = Sum of prices / Time span = 35/5 = 7
An exponential moving average (EMA) is similar to an SMA, but its formula uses a higher weighting for more recent prices. The EMA formula is here. You can use either simple or exponential moving averages, but I prefer using EMAs since there is less of a lag between current prices and EMAs compared to SMAs. Furthermore recent prices should capture more relevant market information and should be emphasized.
Here are some of the ways you can use moving averages:
1) Establish a trend.
You can use shorter term and longer term moving averages just to establish if an asset is trending up/down/or sideways. We have 5/10/20/50/100/200 day EMAs shown below in different colors.
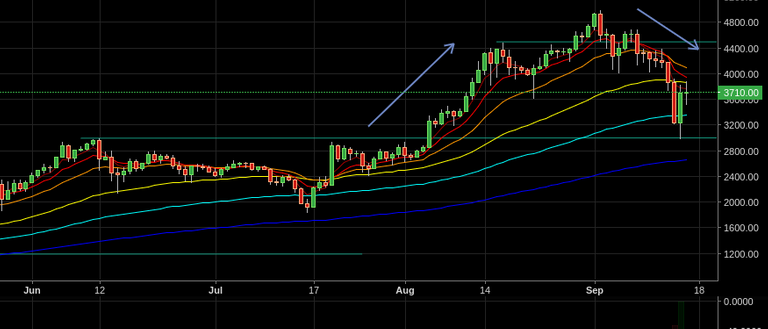
You can see all the EMAs moving upward from August to September. However you can see shorter term moving averages 5/10/20/50 day EMAs in brown/red/orange/yellow turn down recently. The longer term 100/200 day EMAs in cyan/blue still trend upwards, but seem to be flattening. It is also good to monitor turning points in trends, especially longer term ones.
2) Using EMAs as support and resistance.
In our previous post we established support/resistance levels using breakouts into all-time highs. You can also use EMAs as support and resistance levels the same way. In an uptrending market EMAs are support levels. When prices touch or move lower near EMAs (ie. average prices) that may be an indication prices are in a temporary downswing with a higher potential to bounce upwards to continue the upward momentum. The reverse is true when the trend is down. EMAs serve as resistance levels.
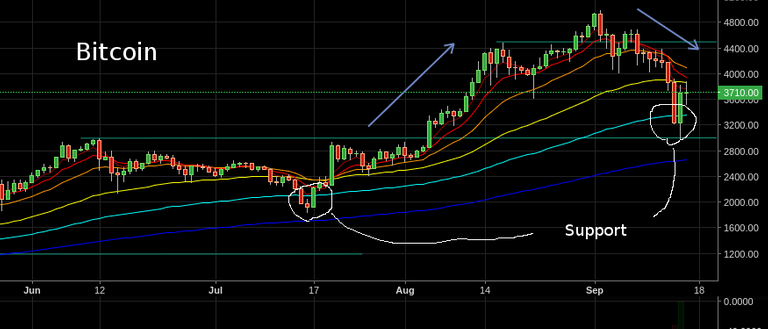
Although prices broke through the 100 day EMA (cyan trendline), the 100 day EMAs seem to be a good support level for Bitcoin.
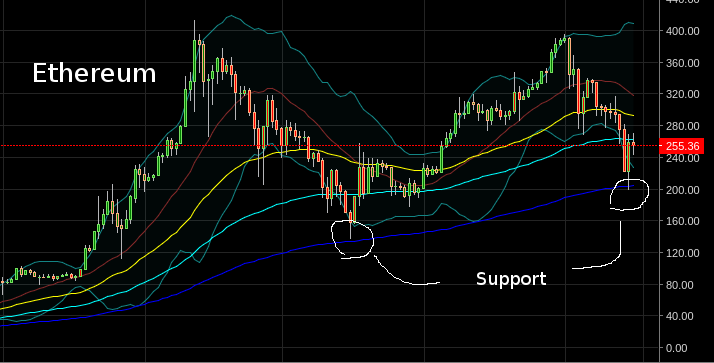
The 200 day EMA (blue trendline) held strong for Ethereum.
3) Price crossover.
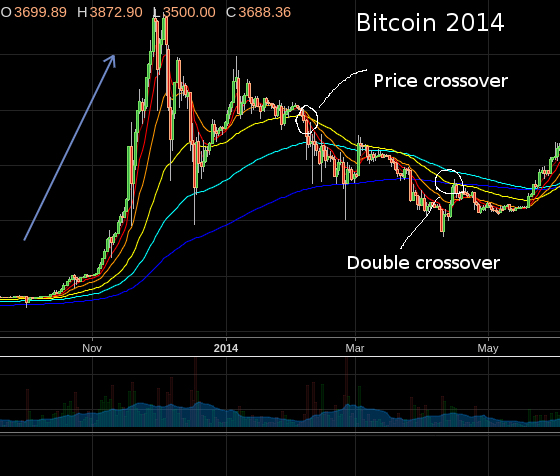
When prices move above or below an EMA instead of bounce that may indicate a longer sustained trend and a possible reversal of a previous trend. Crossovers can be used as breakouts or breakdowns of resistance or support. Below you can see the prices represented by red candlesticks cross below the 50 day EMA (yellow) around Feb 2014. This was some indication of a longer term downtrend in Bitcoin prices.
4) Double crossover.
You can also monitor when one moving average crosses over another. In the above you can see the 50 day EMA (yellow trendline) cross below the 200 day EMA (blue trendline). When a slower moving average crosses above a longer moving average this is called a golden cross and indicates an upward trend; when it crosses below this is called a dead cross and indicates a downward trend.
Here is another good resource for moving average analysis I recommend reading.
I’ll go over MACDs in my next blog post. Until then happy trading!
Note: This is for educational purposes only.

China can't be bad if people are smart, just change your ip if you are in China and use any exchange or ico. ☺
HODL
Heaps Of Delicious Litecoin
Similar to what happened in 2014 Bitcoin has crossed below 50 day EMA recently. Is this a sign of a downtrend for the coming months? Awesome post, I learned a lot :)
Yes it's hard to say. Earlier in 2017 we had another price crossover below the 50 day EMA, but it rebounded strong to new highs. We'll see this time around. Hopefully it stays above 3,000 or at least above the 200 day EMA.
Thank you for the clarification
Hi @steemrolling, This is my very first comment on your posts. I've read several articles on the same topic but to be honest, none of them was this much detailed and helpful to understand the issue to the core. Thank you and I look forward to reading some more such value-packed articles.
I am useful for the analysis. Thank you very much.