
ETHUSD
So Bitcoin prints another all time high, hitting the $6300's before entering consolidation, and yet again we should be looking to altcoins for trading opportunities.
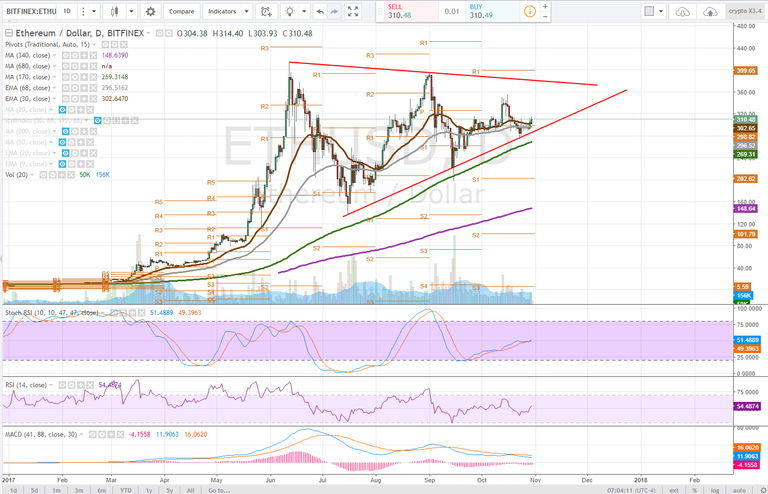
Daily
On the daily time frame, we have been tracking this wedge formation, expecting another test of the lower trendline which has since been delivered. Before the price bounced back above the pivot.
The price has also reclaimed the 68ema and 30ema as support. Some consolidation should be expected but in the sense of a broader trend, we are observing higher lows as the range tightens.
The Stochastic RSI on this time frame continues to trend up with the RSI. The MACD is extremely close to delivering a bullish cross and potential bullish divergence which would indicate a reversal in trend momentum.
Important support to hold is our trendline and target to break is approximately $340-50 the range ETHUSD hit going into its fork.
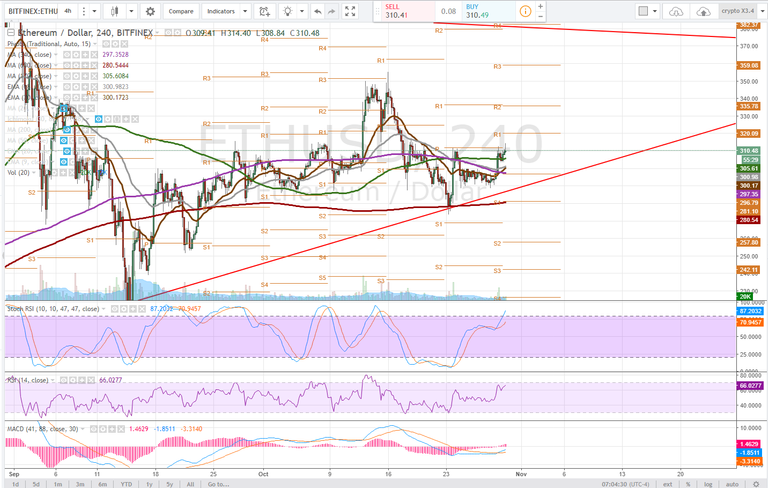
4 hour
On the 4 hour we see support was found at the 680dma and the price since bounced above pivot on this time frame which has begun to drive a series of bullish moving average crosses (shorter term above longer term is bullish). The price is now settling and testing above the 170dma and we should be looking for the price to hold.
There is also a possible bull flag forming here, and we would look for consolidation on the 170dma to result in a break higher for a test of pivot R1, $320.
The stochastic RSI is only just entering uptrend and the price action drove a bullish macd cross on this time frame. An uptrend is clearly observable in the RSI. A key level for the price to hold on this time frame if the 170dma cannot provide adequate support is the pivot, $296.79
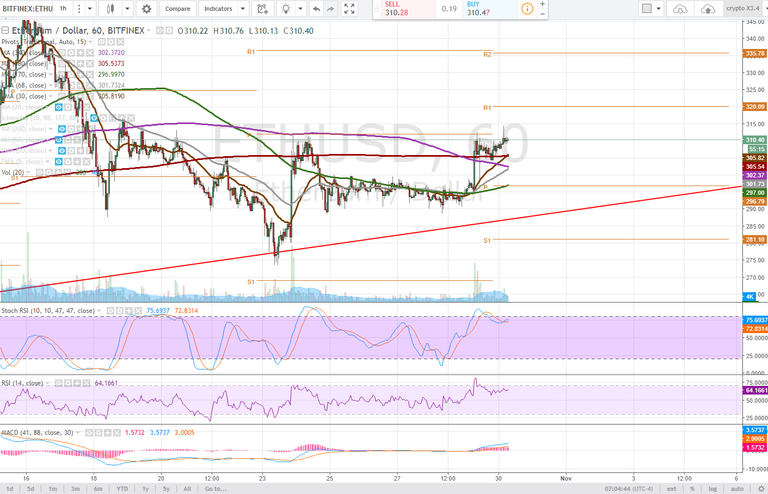
1 hour
On the 1 hour time frame the bullish convergence of moving averages is more observable and price found support at the 680dma. The 30ema is now converging and should offer additional support if the price pulls back. The bull flag is clear on this time frame and as the consolidation range tightens traders should look for a break higher. Turning pivot R1 into support rather than rejecting it entirely (selling off) is going to be essential in observing price progression within the broader chart formation (daily wedge).
The stochastic RSI on this time frame as well is hovering just below the 80 line and with another bullish cross should push higher into uptrend. The MACD is trending higher and a surge of volume to the upside would negate the current curl in its form. The RSI is consolidating just below 'overbought' status and this aligns with the current bull flag formation we are observing.
Bullish Above: $312
Bearish Below: $288
RISK TRADE: Accumulate a long position, under the expectation this bull flag breaks to the upside, add on tests of the 4 hour 170dma, set sell stop just below $300 - $300 should offer psychological support as a supply and demand zone, but losing this price could turn the chart very bearish, very quickly.
Don't forget to use stop losses!!!
Previous Articles:
XMRUSD
ZECUSD
LTCUSD
BTCUSD
ETHUSD
BTCUSD
LTCUSD
Follow at your own risk, Not a financial adviser, understand the risks associated with trading and investing. Manage your own Risk - in other words you could lose it all and it's your own fault.

wao good content keep it up
Keep it up @satchmo
I hadn't check ADSactly bots yet and already got the BTC at 6300 news from you here
That's definitely a great Spoil! XD
Just go to BCH chart. the storm is coming , HODL tight
everyone trying to call tops and storm clouds for bitcoin reminds me of everyone trying to call tops and storm clouds on the DOW and S&P ... broken clock is right twice a day