What determines when a Bubble Bursts?
Buyers! Let's start here. The simplest explanation of when a Bubble bursts is when Buyers run dry. When there are no more buyers to purchase a commodity at the current price levels, we see a sharp, and volatile decline in price. And that is exactly what happened in 2013/2014 when Bitcoin's bubble burst. We had a Market Cap of around $13B but we just ran dry of anyone new to enter into this market to purchase at that price level.
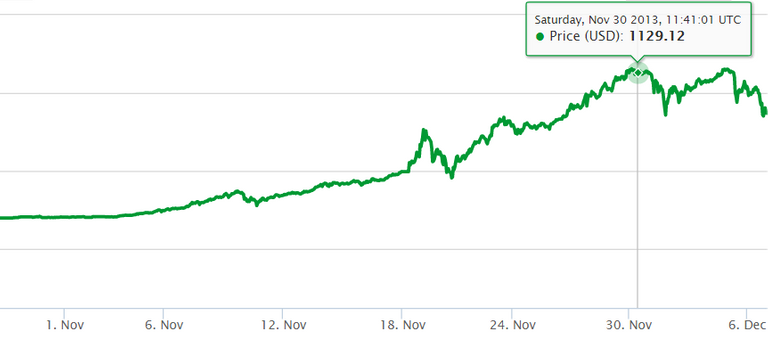
In fact, looking at the data, the price of Bitcoin in November 2013 jumped 5x, above the $1000 level within less than 1 month. And then it just started dropping back down to Earth. This was happening when there really wasn't a market available to support it. With no new developments to justify the movement and really no technical methods to test it we came back down to earth over a number of grueling months.
And now we're again in the next phase of some incredible gains in 2017. Are we lacking buyers? Certainly not. Let's take a more detailed look to see if we can stay afloat during our current growth phase.
Measuring the "Health" of Crypto

As Crypto continues to gain acceptance and move upwards, the question of what is "healthy" growth continues to come up. Unlike the stock market, we do not have a long enough price history to truly extrapolate when there is under or overvaluation, or tools to understand what a bubble would look like in Crypto. We can only use analogies and comparisons to previous bubbles that have been witnessed in other industries of the past.
Moving averages, RSI levels, Elliott Wave Analysis, and other methods of technical analysis can help us better understand and possibly predict short term movements, but when we look at the larger picture, is there a way to understand if there are enough Buyers to maintain and continue to elevate the market up?
To understand this, let's look at the closest analogue, the Stock Market.
Using the stock market to help us understand a bubble scenario
In the stock market the P/E ratio (Price to Earnings) measures the Price of a stock and divides it by its Earnings. The purpose is to understand how much greater its perceived market value is to what it actually rakes in. This ratio is heavily relied upon and is a solid way to understand if a stock is "hot", overvalued, or undervalued and in need of correction in either direction.
However, Crypto doesn't really have a P/E ratio so to speak. But, it seems there may be a new metric that can guide us in the same way. Market Watch posted an article a few days back identifying a version of the P/E ratio in crypto. And it seems to hold up thus far.
The key is in understanding the relationship between (1) Market Cap and (2) Daily Transaction Volume. Let's first understand these terms and then show how they come together.
What does Market Cap tell us? A price is just a price unless there is reason for it to be "priced" that way.
Market Cap simply signals the current value placed on a commodity as a whole. By itself, it doesn't provide an inkling on the actual health of a commodity maintaining, growing, or shrinking from that value.
As an example, during 2013 when Bitcoin reached over $1000, the price looked amazing, but there was something underneath it that made that bubble pop. The key was Bitcoin had grown in price, but.. something else didn't balloon with it. And that's VOLUME. Let's understand Volume better and why it makes a difference in determining the Health of Cryptocurrencies
Why does Volume matter? Can an Eskimo sell a block of ice for $1 Million in a market of 2 persons?

At the height of Bitcoin's market cap in 2013/2014 we saw a day with a $200M daily transaction at the peak to hold up a $1000+ price in the figure above. In February 2017 when Bitcoin was at the same price again, the daily volume was roughly the same too. What's the difference? The average daily volume during the boom in 2013/2014 was around $50M whereas in February 2017 we were averaging around $150M on a daily basis.
That's 3X the average number of transactions at the same price level during two different time frames. And volume is part of the secret which allows the price to stay buoyant and to grow beyond it.
So, the more transactions that take place, the better the health of Crypto? Not necessarily. In an isolated setting, volume it tells us very little about the health of Crypto, just like Market Cap in isolation does very little for us.
The higher the Volume of transactions means more players are there, sure. And as long as it's kept in check, higher volumes can signal positive health. However, higher volumes can also become a nightmare for the health of the currency if it's happening when the market cap is declining indicating a sell off. So we can't assume high volume means a stable, or appreciating currency.
The Health Ratio: Our new P/E to Predict the next Crypto Bubble Burst (maybe)

You may now realize that Market Cap and Volume have an important relationship with one another. So let's put it all together. As with our case of 2013/2014 when Bitcoin rose to over $1000, the transaction volume (i.e. Buyers) just couldn't maintain its price. When no one is buying, sellers take over until a balance kicks in again. Wouldn't it be nice to be able to capture this phenomenon as a way to warn us of the current Health of the crypto space? Seems there is.
Chris Burniske, a blockchain analyst at ARK Invest, came up with a simple ratio. It simply divides the Market Cap by the Daily Transaction Volume. If the value is within a channel it can be considered healthy. If it's outside this channel then we may want to watch out. Let's showcase this ratio and see how it applies.
I'll refer to this as the M/V Ratio for simplicity here.
(1) The basic idea is we take the overall Bitcoin Market Cap which is
*USD $43.4B* (as of the writing of this article)
(2) Divide it by the daily transaction volume of
*USD $1.425B* (As of the writing of this article)
(3) Final M/V Ratio
$43.4B/$1.425B = *30.5*
What does the M/V of 30.5 mean and how does it tell us the health of Bitcoin? Let's use an example from 2013.
Understanding the M/V Ratio
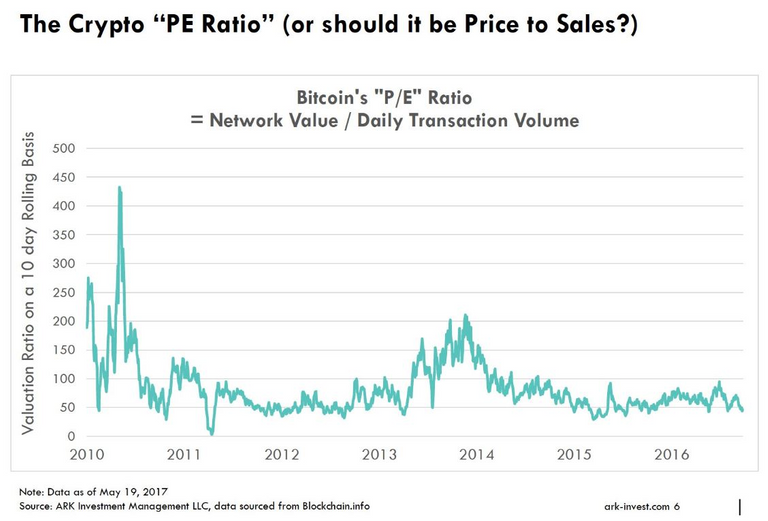
In 2013, the price of Bitcoin reached well over $1000. However, as we covered earlier the price was rising but the volume wasn't rising as quickly. This pushed our M/V value up to around a value of 200.
That's 7X higher than today's M/V of 30.5.
This meant that we saw artificial hiking of price within the same circle of investors, but there weren't enough new buyers entering the market to keep the price at that level. From there it came crashing back down to manageable levels.
Chris believes that as long as we are playing around the M/V Ratio of 50 we're good.
Much higher means we're again lacking the volume to sustain the price gains. At the same time going much lower than 50 can also be problematic. It could mean there is a massive selloff happening as price plummets and volume increases to sell off the currency. So we don't want to go too far below 50.
In the meantime, we seem to be in a generally healthy M/V range, even with the usual volatility of huge gains and losses. But, no, it doesn't seem we're in a Hyper Bubble yet.
What do you think of the M/V Ratio?
Note: This is not investment advice. I am simply sharing my personal observations and analysis based on information available.
Images:
http://aaronlayman.com
http://cdn.moneycrashers.com
http://www.cagle.com/
This seems like a very interesting. Indicator, I will keep an eye out for it. Do you perhaps have more info on it or a visual example of the "channel" you mention? Thanks for the info!
Hey. Thanks for saying so. I've updated the post with an image that can show you the way the channel has formed over time. Hope that helps!
Oh wow, thank you so much!
The theory is flawed in several ways. Stocks are not only valued by p/e. For certain stocks it makes more sense to value them by price/book value. If you apply this measure to the crypto space, a solid developer team could fit in as human capital. Another thing is how well each project is financed.
Imagine if vitalik buterin quit Ethereum tomorrow. You would be lucky to get 200 dollars for your eth once it got known. Ethereum would go on with it's business as it has, but suspicion and mistrust would collapse the price.
Fair enough that P/E isn't the only way to value stocks. However, it was more of a stepping stone to provide some common ground, as an analogy, to the Market Cap : Daily Transaction Volume ratio.
And you're right about the fundamental issues inherent with the performance of any specific Crypto in the space. Do not deny that at all. However, what I tried to do here was focus on the Technical Analysis instead since the Fundamentals are a whole other story :)
Thanks for the thoughts!
PE ratios are a poor measure to determine "value" becuz the "E" part of PE is based on anal-yst projections and anal-ysts are wrong more than right. Also, not sure you realized it but the PE of Enron when it was trading in the high $20's before complete collapse was only 3. In general, the stock market always gives "tells" before the asset it is pricing collapses from a bubble. If you do some reasearch you will find that the housing stocks set their highs in the spring of 2005, well before home prices topped in elate 2006 early 2007. The U.S. exchange traded bitcoin tracker GBTC actually failed to set a new 52 week high even as bitcoin itself just made a new high. This is a "tell" imo.
http://bigcharts.marketwatch.com/advchart/frames/frames.asp?show=&insttype=Stock&symb=gbtc&x=47&y=15&time=5&startdate=1%2F4%2F1999&enddate=6%2F12%2F2017&freq=1&compidx=aaaaa%3A0&comptemptext=&comp=none&ma=0&maval=9&uf=0&lf=1024&lf2=2&lf3=8&type=2&style=320&size=4&timeFrameToggle=false&compareToToggle=false&indicatorsToggle=false&chartStyleToggle=false&state=11
Volume in "actual" bitcoin decreased dramatically over the weekend so far, even as they drove price well above $2600. This could also be a tell.
http://bitcointicker.co
Volume spiking dramatically on selloffs however.
Great points! I also agree that PE isn't the only way to quality check on the value and quality of a stock. It was just a method to provide a segway into discussing the Market Cap to Daily Transaction Volume ratio.
I definitely can see your point on foretelling of the housing market crash and on Enron. If we ignore Technical Analysis, at a fundamental level there might be a difference between these and the crypto space as of right now. The main aspect is simple scale. The Housing Market was centered on the U.S. Market with financial institutions performing nefarious deeds in the background by taking on far more risk than they should have with subprime loans. Enron, in an isolated way, was one of the worst cases of messing with accounting reports, hiding up bad deals, and the like. However, I don't think Crypto really fits the mold for either of these because of the nature of why those spaces crashed.
Crypto is sitting on top of a global market, not one focused on any single country. As a result there is considerable space to grow. And the growth is speculative, sure, but the climb up has really only begun. To say it's over before it's really begun to play in this round of growth might be zooming in too much on the recent downturn, as we've seen this behavior at least 4 times over the past 6 months. Each time we set new highs, and each time we're seeing a larger number of investors coming into the space. But we haven't even reached mainstream audiences, not remotely. So I'm not concerned about the top of the bubble just yet.
As for GBTC, their share prices were WAY overvalued to begin with. Around 2X for what a share represented to the equivalent value of Bitcoin. The reason for that is likely that they were really the only guys in the space focusing so heavily on Crypto. Investors who wanted to dive in but not have to deal with buying crypto directly saw this as their only vehicle. As time moves on we should see further corrections with GBTC down to a more accurate price level. I don't really see it as a tell that we're going to crash because of that.
As for Volumes, yes they did fall over the weekend, but that usually happens after a major spike up or down. Key is to keep a watch of what happens moving forward :)
Great thoughts. Keep them coming!
Also "decent" points except you admitted that you wouldn't want to be "isolated" in bitcoin, and if China truly is "controlling" pricing in bitcoin as the guy in this interview thinks (and I agree with), you are isolated by the whims of river boat gamblers...becuz that's what the Chinese are whenever they see a "frenzy." They loooove to "gamble." :-)
My indicators monitor only sentiment via price so if GBTC is that grossly mispriced it could still possibly mean that the "actual" bitcoin price is also driven on speculation. I go by the theory of waiting for prices to rally waaaay above a price that we "know" is going to be taken out. And then play for the "adjustment." GBTC still has a date with at least 160.00. I don't see anything that will change that altho the high on GBTC could still get taken out. But that would be a very tuff "sentiment" climb. Anyone who paid $500+ for GBTC is just "praying" for a move back above $500. I still think we will find out soon if it is an actual gauge for "live" bitcoin. Right now no change to my current outlook...even after GBTC opened up theu $426.
ON the previous bouts of selling the volume remained strong on the weekends. The overall volume in bitcoin was strongest when the Chinese (that's my story and I'm sticking to it) were running the price up. I imagine Chinese boiler rooms are likely mining the majority of bitcoin? That's a fundametal thing you could check out to help with the decision to sell here or hold. I just watch sentiment and sentiment only.
Enron basically took the entire blame for what happened in the natgas sector. There were at least a half dozen other companies that were equally as fraudulent yet when Enron went defunct they all rose from the dead. Chesapeake energy was one. It's back down "near" dead but this is the one I still watch periodically, WMB. This company should have gone defunct along with enrob, Calpine was another one.
http://bigcharts.marketwatch.com/advchart/frames/frames.asp?show=&insttype=&symb=wmb&x=62&y=21&time=18&startdate=1%2F4%2F1999&enddate=6%2F12%2F2017&freq=7&compidx=aaaaa%3A0&comptemptext=&comp=none&ma=0&maval=9&uf=0&lf=1024&lf2=2&lf3=8&type=2&style=320&size=4&timeFrameToggle=false&compareToToggle=false&indicatorsToggle=false&chartStyleToggle=false&state=11
My "theory" states that all pricing reverts back to the place where the "mispricing" began...no matter how high above there the price goes. WMB "should" still go defunct because it never paid for past fraud. A real market will eventually price it properly imo.
Thanks for informative post.