Gold - A long Term Price View
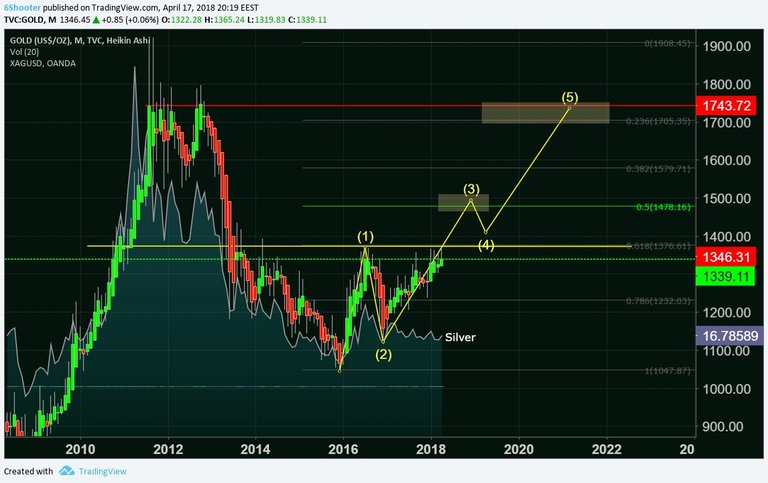
The Gold Chart - Monthly Candles, The Fibonacci is drawn between 2011 high and 2015 low.
At present Gold is attempting to break the resistance at $1376 which also coincides with 0.618 on my Fibonacci scale. This has vestiges all the way back into 2010. This is a strong resistance point on the chart.
If/when Gold closes over $1376 then there is little resistance until $1478 which appears to be a profit taking opportunity, with a retrace back into the area of $1400 followed by a strong leg up to the $1700 area.
Ultimately, the chart seems to indicate Gold in the area of $1700 to $1750 in early 2021.
Please, Don't forget to upvote and Follow Me, It's additional encouragement for me to share my work.
All statements and expressions I offer are my opinions, and not meant as investment advice or solicitation. Information provided is not personal investment advice. Seek guidance from a professional investment advisor before trading or investing. Trading cryptocurrencies can be a potentially profitable opportunity for investors. You should carefully consider your investment objectives, level of experience, and risk appetite. Most importantly, do not invest money you cannot afford to lose. I am not a registered investment advisor.
Wishing you success,
Isaac
CryptocoinAdvisor.com Free Charts, Trading, Investment Information
My work can also be seen on Tradingview
Get Your Own Tradingview Charts
My Free Newsletter
Check Out The AI Trading Bot I Use
My Steemit - Decentralized Blockchain Based Blogging