In this post, we take a look at How to Create Violin Plot in R. This plot is often used by the data science users on specific set of the databases. And it's a very good plot for you to learn how to use and customize your settings. It'd teach you small interesting things there.
In previous post, I covered how to make the Strip chart in R. You can take a look at that post and also try to do this on your own. And it would be a good start for your set of tutorials. I'll be adding in more tutorials specific to the ggplot2.
Make sure to download the RStudio IDE and then try to execute some of the examples in this tutorial with the same. You would be able to do pretty interesting set of the plots with the RStudio. If you happen to use any other IDE then do let me know in the comments.
I have created a video to give you an overview on How to Create Violin Plot in R. You should give this one a try.
Let's start.
First thing is to get the libarary and also get some sample data on which we can draw the plot. I know it would take a bit of your time but do try it and it's pretty quick to make a chart out of that.
library(ggplot2)
and then we can think of the dataset here. Like say you have "diamond" dataset. This dataset should be something we would be making use of for plotting.
ggplot(diamonds, aes(x=cut, y=price)) + geom_violin()
That's it. Now let's check out the plot the image below.
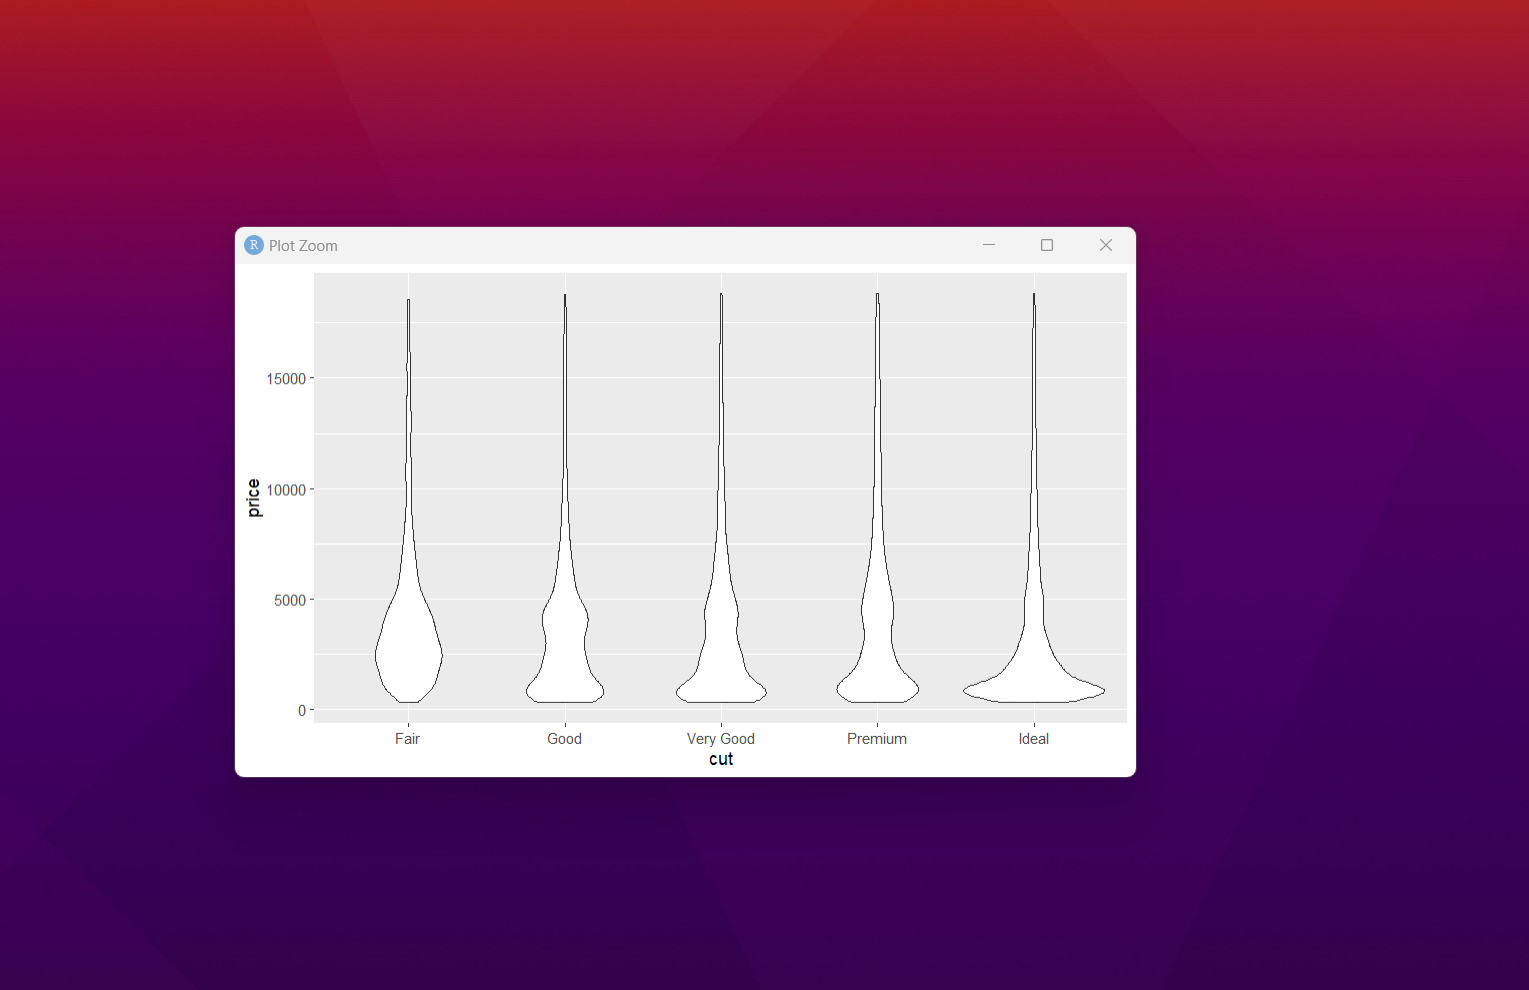
As you can see the plot would show you the diamond cut and price. This would be showing up in the chart as you can see. It would also show you the labels based on the diamond cut. And that would reflect in the chart label too.
That's it for the Violin chart. You can experiment with other datasets and also see if this one is something you can try out. There are also variations of this chart and also there are some of the issues that you would come across while plotting, as you do more of solutions you would find out.
I would be also covering the data science tutorials specific for the Python too. I have covered some of the concepts in the past tutorials. Once the R specific tutorials are covered then I would be going towards the tutorials with data in the cloud. Specifically for the Google and AWS.
I have done few more of the tutorials like that. I am also covering the PowerBI tutorials soon. Maybe I would be posting more tutorials on that part. I just want to see if I can cover a lot more topics in near future. So far science specific tutorials I have covered and they are in stem community as of now.
If you happen to like this content, do give me feedback over there and that would help me improve my efforts in near future.
Thanks for your contribution to the STEMsocial community. Feel free to join us on discord to get to know the rest of us!
Please consider delegating to the @stemsocial account (85% of the curation rewards are returned).
You may also include @stemsocial as a beneficiary of the rewards of this post to get a stronger support.
Congratulations your publication has been chosen among the best of the day.
KEEP CREATING GOOD CONTENT.