Today I want to talk to you about one of the most useful and important technical analysis tools for which we trade: The RSI indicator. I am going to focus on its particularities, how it is built, interpreted and configured correctly.
The RSI or Relative Strength Index is an oscillator-type technical indicator that is plotted below the price chart.
It is one of the favorite oscillators of traders, in fact in a recent survey it was chosen as the favorite oscillator among traders around the world. It was designed in 1978 by Welles Wilder, one of the great fathers of technical indicators, and presented this indicator as a tool to measure cycles.
Its formula is the following, do not be scared that I will explain it to you and you will see that it is easy to understand:

With this indicator, Wilder managed to measure the strength of a trend, taking the number of bullish sessions with respect to the bearish sessions, taken to percentage in the formula. That is what RS means in the formula, Relative Strength, and what is put there is the average of the gains in the bullish candles divided by the average of the lost in the bearish candles. That is, from the period selected by the oscillator, normally 14 periods, those that have risen are taken, the average rise is taken, and it is divided by the average loss of the periods that have lost. The rest of the formula is just a way to index it between 0 and 100.
Now that you know better how the RSI is calculated, you will see that it is no magic formula, there is no mystery behind it, just a way to measure the rises compared to the falls taken as a percentage.
RSI parameters
When Wilder designed the RSI he did so with a standard parameter of 14 periods and with an overbought zone above 70 and an oversold zone below 30.
As a general rule, I think it is not necessary to complicate your life by changing this parameter of 14 periods for any temporality. Why? Because the higher this parameter is, the flatter the RSI chart will be, and the more difficult it will be for it to reach the 70 and 30 levels. Look at this chart:
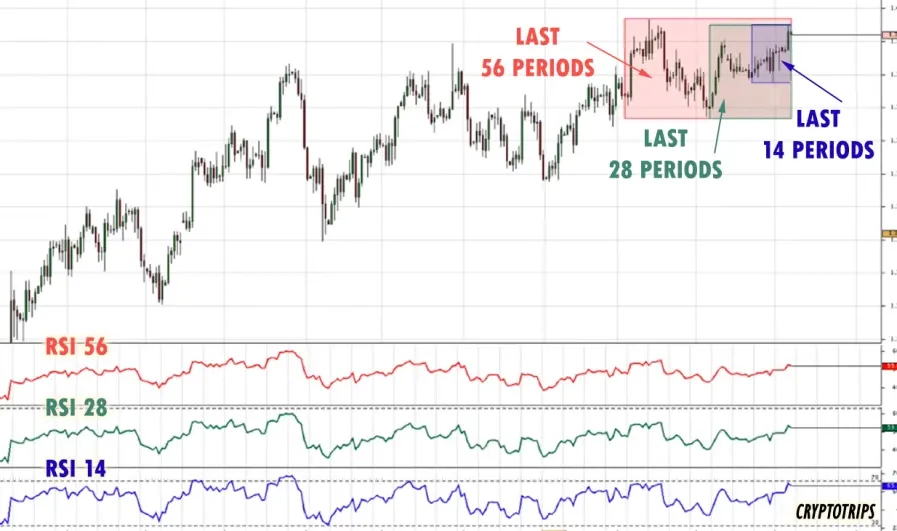
In the image you can see that I have put three RSIs with three very different parameters: 14, 28 and 56 periods. The 14, which is the standard, takes the last 14 candles to measure relative strength and compare bullish candles with bearish ones of the last 14 periods; the 28, the last 28 candles, and the 56 takes the last 56 candles.
You can easily see that the RSI look is basically the same, all three go up and down more or less in the same places, the only small visual difference is that the RSI's vertical scale of 14 was more stretched, and that makes it reach the levels 70 and 30 more easily. In fact if you look closely, you will discover that the RSI of 56 never reaches those levels in the example of the image. Do you know why? Because the higher the number of the RSI parameter, the more candles it will be computing to compare its bulls and bears, and precisely by the law of large numbers, the more candles you count, the more likely it is that there are half of one color and half of another; for the higher the parameter, the flatter the RSI will be, staying around 50, therefore any parameter that you put all these RSI will mark the cycles in the same way, there will be no difference.
The only real difference will be that you will have to change the overbought and oversold zones for figures closer to 50 the higher the parameter, and that is why I recommend that you leave it at 14 and that's it, don't get too much crazy playing with this parameter. What will be important is that you carry out research for the asset, timeframe or market in which you are going to use the RSI, to decide if you are going to maintain 70 - 30 as overbought and oversold levels, or are you going to change them.
Remember that there is no technical indicator better than another, there are only traders who prefer one or the other. In summary, no technical indicator is a magic invention that will give us infallible trading signals, they all take the price data and represent it in another way. The decision to use the RSI should be accompanied by a small study to decide what overbought levels to use, or if you are going to keep the standard 70 - 30.
And one last important issue: you should not confuse the RSI with the RS. Here Wilder got the name wrong because they are too similar and can lead to confusion: the RS or Relative Strength, (which is not the same as the RSI) is a way to measure the behavior of an asset with an index or sector, to see if it is stronger or weaker, and should not be confused with this RSI indicator, however much the name may sound like it.
As always, research, read, learn, enjoy, follow me (the less important one) HERE... and with or without RSI, be happy!
Congratulations @crypt0trips! You have completed the following achievement on the Hive blockchain and have been rewarded with new badge(s) :
You can view your badges on your board And compare to others on the Ranking
If you no longer want to receive notifications, reply to this comment with the word
STOPTo support your work, I also upvoted your post!
Do not miss the last post from @hivebuzz:
Amazing stuff. Keep the knowledge tap open. I am here to learn 😀
Thanks for your comment! Learning and Psychology are everything on Trading 😀
Agreed. Learning can be done but psychology comes from practice. For that, you need to trade.
I have read your post on Publish0x
Good information for everyone!
Well done.
@tipu curate
Thanks Eddie for your comment, and for read me everywhere! 😀
ahahahahah! Your posts are always good man
Upvoted 👌 (Mana: 6/12)