Welcome to the daily financial report about the Hive blockchain.
All the information presented in this report is based on the data collected from the blockchain until 2021-08-26 midnight UTC. This report aims to provide you with a clear view of what is happening on the Hive blockchain.
1. Price
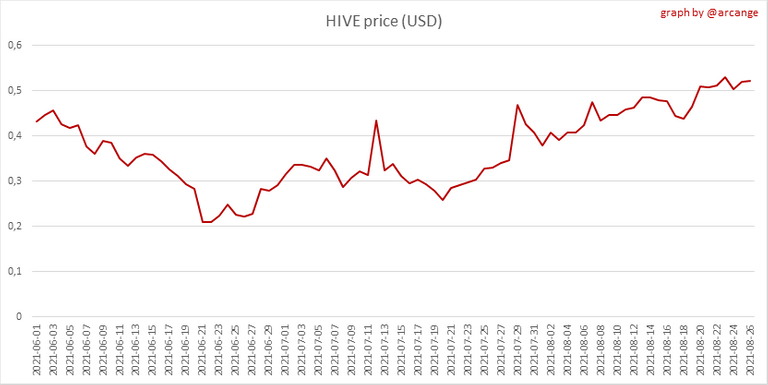 | 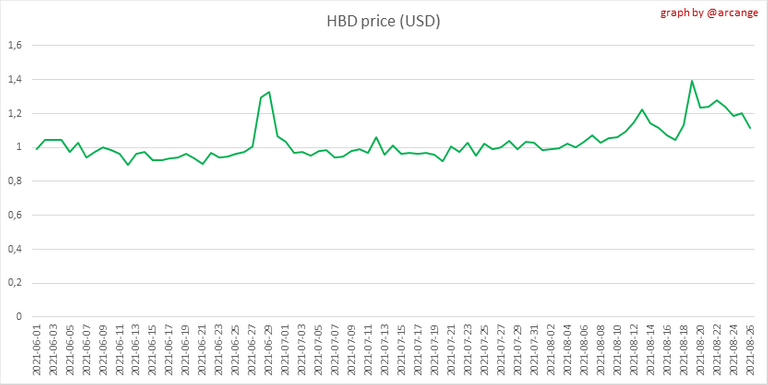 |
These graphs show the evolution of prices in USD for HIVE and HBD.
2. Supply

This graph shows the evolution of HIVE Virtual Supply. The virtual supply is the sum of HIVE supply (liquid Or staked HIVE) and the HBD supply (converted into HIVE).
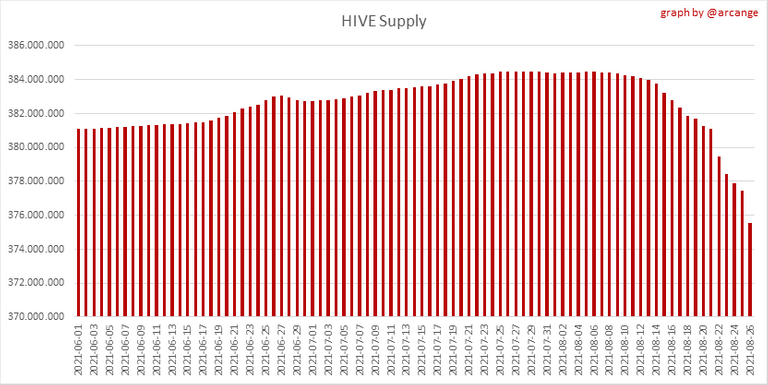 |  |
These graphs show the evolution of the HIVE Supply (both liquid and staked) and the HBD supply.
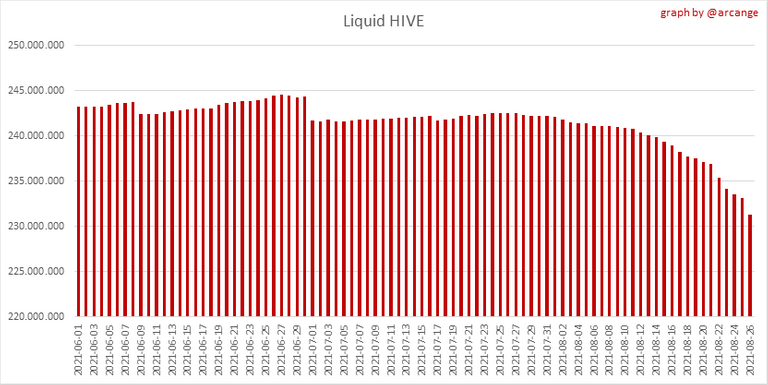 | 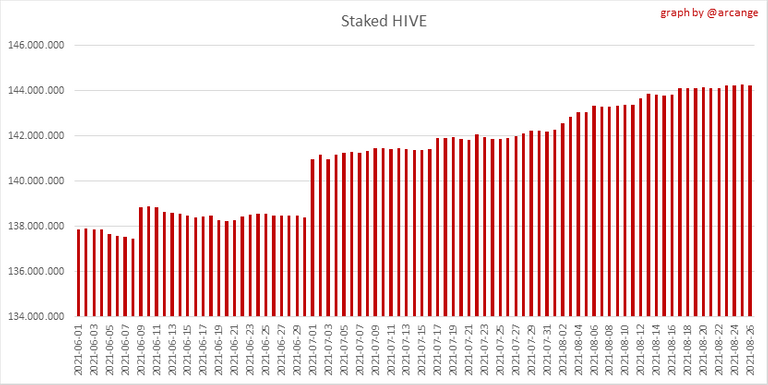 |
These charts show the evolution of the liquid HIVE and the staked HIVE (Hive Power).
3. HBD Savings
Note: As of 2021-06-30 (HF25) interest Is only paid for HBD which are stored in savings.
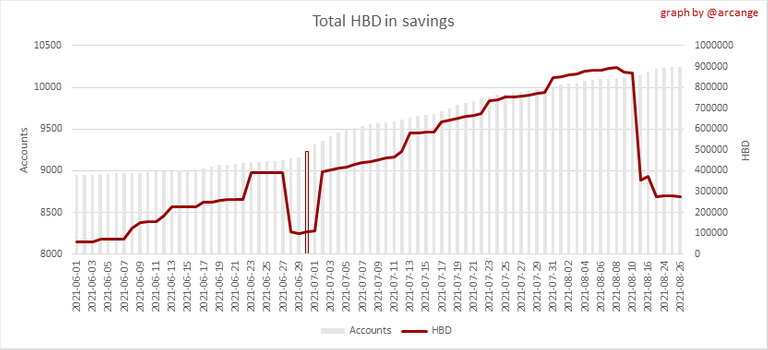
This graph shows how much and how many accounts store HBD in savings.
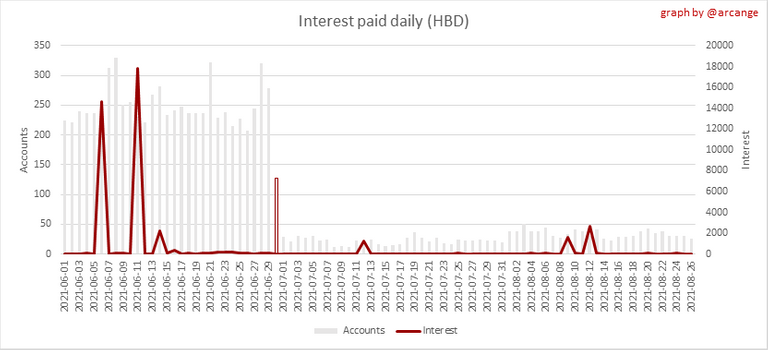
This chart shows the amount of interest paid each day for holding HBD and how many accounts received such interest.
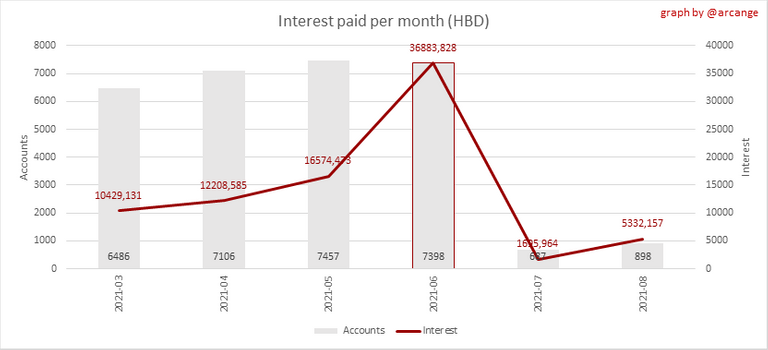
This chart is the same as the previous one, but data are grouped by month.
4. Balances
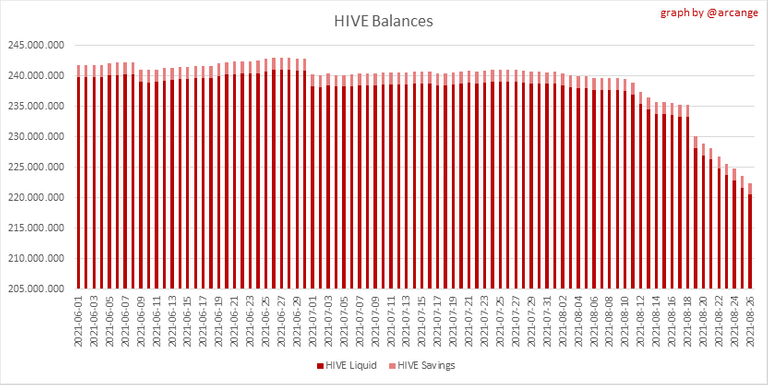
This graph shows the number of HIVE, both liquid and In savings, held by all accounts.
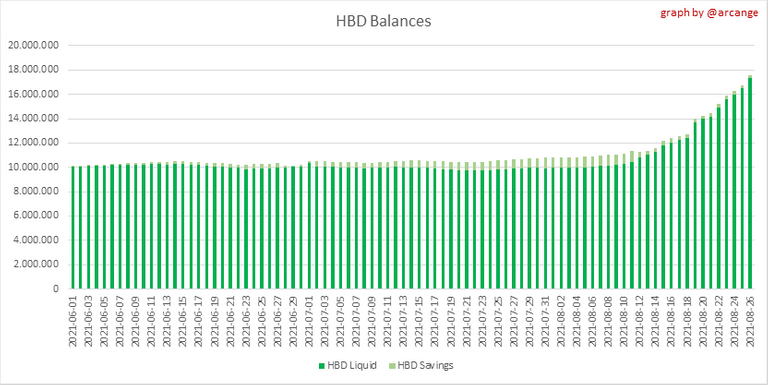
This graph shows the number of HBD, both liquid and In savings, held by all accounts
5. Conversions
Note: As a reminder, conversion requests are only finalized after 3 days. It is only then that it is known exactly how many HIVE were burned in return for the HBD received at the time of the conversion request.
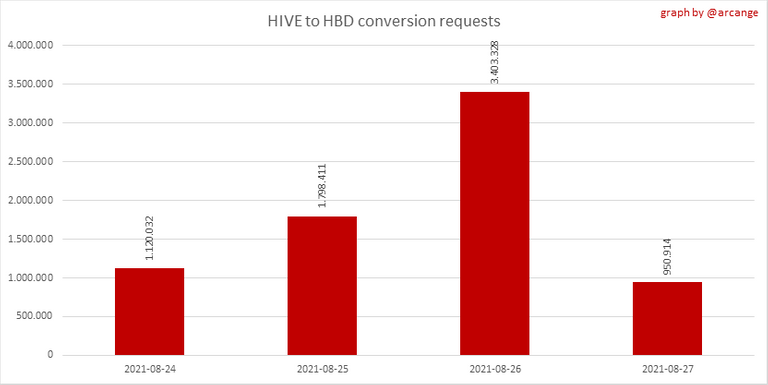
This graph shows the number of HIVE collateralized due to requests to convert HIVE to HBD over the past few days.
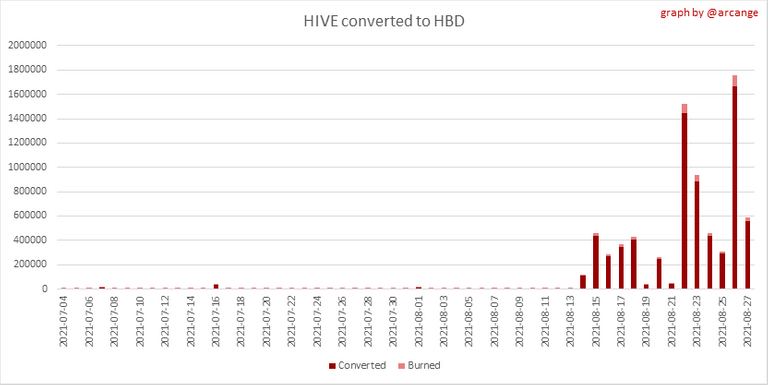 | 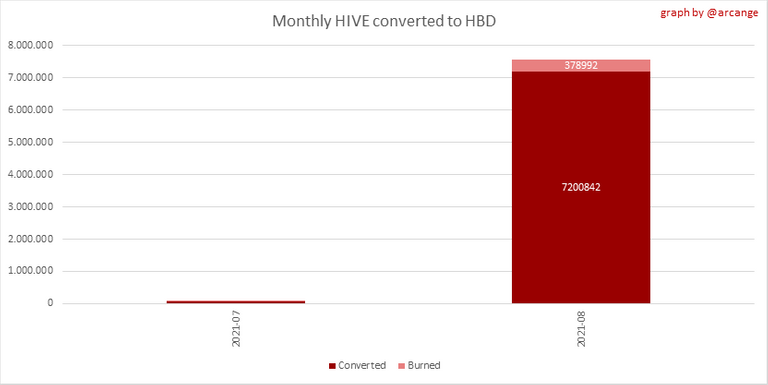 |
These graphs show the number of HIVE effectively used by the conversion process (HIVE converted and 5% HIVE fee which is burned) each day and month when requests to convert HIVE to HBD have been finalized.
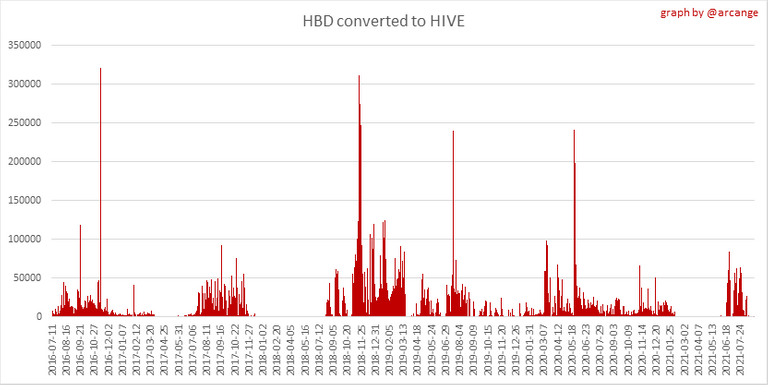 | 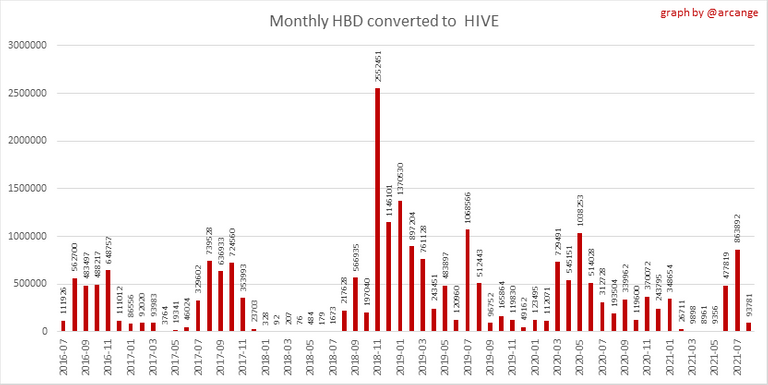 |
These graphs show the number of HBD burned, each day and each month, following requests to convert HBD to HIVE.
6. Power Up and Down
| Date | Account | Amount |
|---|---|---|
| 2021-08-26 07:32:36 | @penguinpablo | 121,479.493 HIVE |
| 2021-08-26 09:27:27 | @hallmann | 12,147.334 HIVE |
| 2021-08-26 06:56:27 | @coinomite | 7,332.216 HIVE |
| 2021-08-26 07:13:39 | @luteum | 7,288.778 HIVE |
| 2021-08-26 01:14:54 | @belkisa758 | 5,432.754 HIVE |
| 2021-08-26 01:14:21 | @belkisa758 | 5,432.584 HIVE |
| 2021-08-26 04:04:30 | @mayifiestas | 3,579.813 HIVE |
| 2021-08-26 04:03:45 | @mayifiestas | 3,579.813 HIVE |
| 2021-08-26 10:24:06 | @syndromet | 3,108.406 HIVE |
| 2021-08-26 07:31:42 | @syndromet | 2,968.138 HIVE |
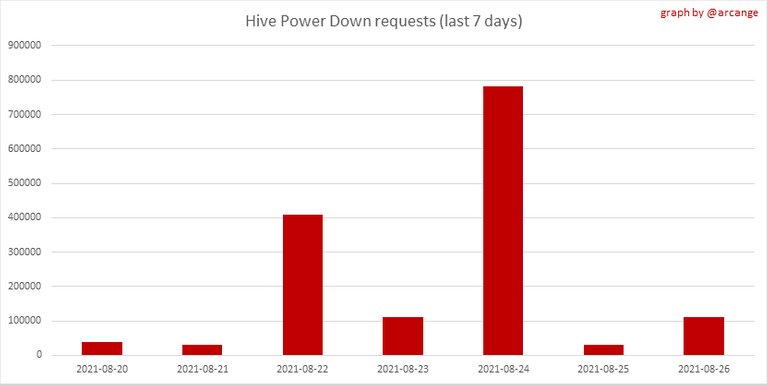
This graph and table show the amount of power down initiated over the last 7 days, and who initiated the largest yesterday.
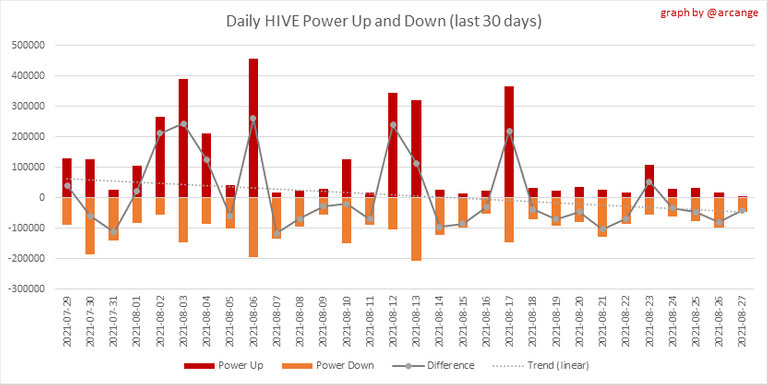
This graph shows the daily HIVE power-up, power-down, and the resulting variation over the last 30 days.
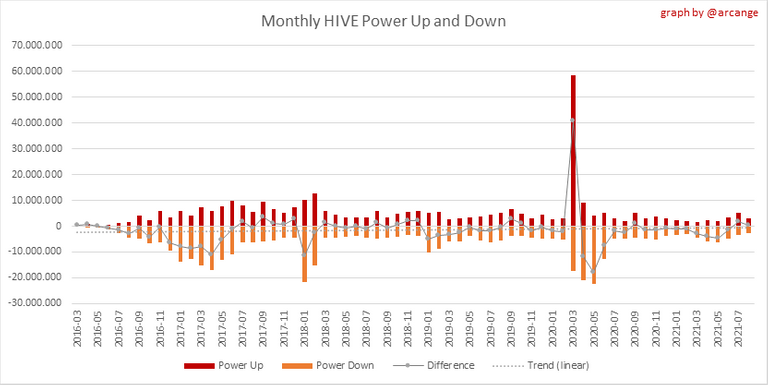
This graph shows the monthly HIVE power-up, power-down and the resulting variation.
Topmost power-ups and -downs today of the day
| Account | Power Up | Account | Powerdown |
|---|---|---|---|
| @iot-blocks | 3,400.000 HIVE | @investment02 | 14,057.710 HIVE |
| @ssjsasha | 1,562.897 HIVE | @peakd | 9,277.216 HIVE |
| @otage | 1,518.374 HIVE | @hbdstabilizer | 6,329.408 HIVE |
| @reward.app | 1,118.184 HIVE | @koinbot | 6,213.215 HIVE |
| @a1004 | 1,002.717 HIVE | @joele | 6,197.001 HIVE |
| @jznsamuel | 890.740 HIVE | @shralve | 5,574.925 HIVE |
| @matt-archy | 600.000 HIVE | @rocky1 | 5,489.745 HIVE |
| @mawit07 | 395.141 HIVE | @nickyhavey | 5,046.489 HIVE |
| @holoz0r | 253.409 HIVE | @bestbroplayer | 4,961.107 HIVE |
| @speed-ride | 239.118 HIVE | @tipu | 2,835.582 HIVE |
7. Transfers
These graphs show the volume (in USD) of HIVE and HBD transferred between accounts.
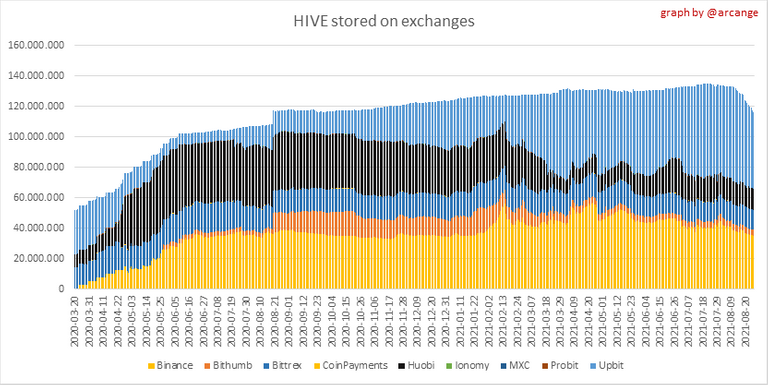
8. Exchanges
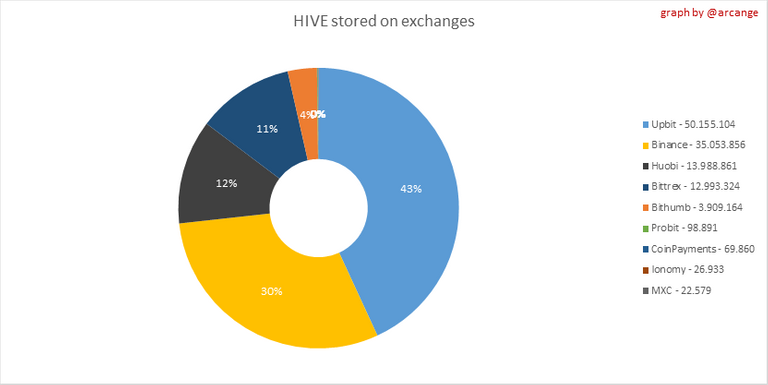
This graph shows the amount and distribution of HIVE stored on the exchanges where HIVE Is listed.
This graph shows the daily evolution of HIVE stored on the exchanges where HIVE Is listed.
I hope you find those stats useful. If you would like to see different stats, feel free to drop me a comment. Your feedback is more than welcome.
Thanks for reading.
Check out my apps and services


Your Blog is so amazing
I'm starting to put some HBD into "savings". Sounds interesting to me.
I would recommend waiting until HBD is at or below $1 in price. At 10% APR, it will take well over a year to match the current $1.15 from savings interest once the token returns to pegged value.
thanks for the advice